
Abstract
Deciphering the activity-conformation relationship of PTPase is of great interest to understand how PTPase activity is determined by its conformation. Here we studied the activity and conformational transitions of PTPase from thermus thermophilus HB27 in the presence of sodium dodecyl sulfate (SDS). Activity assays showed the inactivation of PTPase induced by SDS was in a concentration-dependent manner. Fluorescence and circular dichroism spectra suggested SDS induced significant conformational transitions of PTPase, which resulted in the inactivation of PTPase, and the changes of α-helical structure and tertiary structure of PTPase. Structural analysis revealed a number of hydrophobic and charged residues around the active sites of PTPase may be involved in the hydrophobic and ionic bonds interactions of PTPase and SDS, which are suggested to be the major driving force to result in PTPase inactivation and conformational transitions induced by SDS. Our results suggested the hydrophobic and charged residues around the active sites were essential for the activity and conformation of PTPase. Our study promotes a better understanding of the activity and conformation of PTPase.
Introduction
Protein reversible phosphorylation is one of the most important mechanisms in eukaryotes such as cell cycle, cell growth, proliferation, differentiation and migration1,2. Tyrosine phosphorylation and de-phosphorylation at cellular level are mainly regulated by protein tyrosine phosphatase (PTPase) and protein tyrosine kinase (PTKase) in vivo3,4,5. PTKase (EC 2.7.10.2) catalyze the phosphorylation of tyrosine residue, whereas PTPase (EC 3.1.3.48) catalyze the hydrolysis of a phosphorylated tyrosine residue to remove phosphate. PTPase is a superfamily of structurally diverse signal transduction enzyme6,7, which is classified into four sub-families: (1) pTyr- specific phosphatase; (2) dual specificity phosphatase; (3) cdc25 phosphatase; (4) low molecular weight (LMW) phosphatase6. All PTPases share a highly conserved motif or P-loop C(X)5R(S/T), of which Cys and Arg residues are essential for PTPase activity8,9. Various domains and subunits determine a variety of PTPase functions. PTPases are increasingly identified as potential targets for the related diseases6,7,10.
Thermus thermophilus is an extremely thermophilic bacterium, and has attracted great attentions for its scientific and economic value since its genomic sequence was resolved in 200411. The crystal structure of Tt1001 (PDB: 2CWD), a LMW PTPase from thermus thermophilus HB8, has been resolved at 1.9 Å resolution in 2005. In 2009, we cloned PTPase gene from thermus thermophilus HB27, overexpressed and characterized the recombinant PTPase12. It is well-known the activity of an enzyme is closely dependent on its conformation. Although our knowledge on the structure and cellular function of PTPase is still increasing, little is known how the activity of PTPase from thermus thermophiles HB27 is determined by its conformation. Denaturant is usually used to characterize the activity and conformation of an enzyme13,14,15,16,17,18. Urea is known to break non-covalent interactions. It is more efficient at breaking hydrogen bonds than hydrophobic interactions19,20. Guanidinium chloride (GdnHCl) is a strong denaturant used in physiochemical study of protein folding. GdnHCl reduces the order degree of protein structure formed by water molecules, both in the bulk and the hydration shells surrounding the hydrophobic amino acids, thus resulting in protein denaturation. Sodium dodecyl sulfate (SDS) is an anionic surfactant with a long hydrophobic tail and a hydrophilic head21,22. In the presence of SDS, proteins interact with SDS to form negatively charged SDS-protein complex23. SDS could break the hydrophobic interactions, ionic bonds interactions and hydrogen bonds, while the disulfide bridges are not affected by SDS24.
We have investigated the unfolding of PTPase induced by urea and GdnHCl, and revealed two different unfolding pathways of PTPase in the presence of urea and GdnHCl in 201425. Although SDS is neither implicated in the normal biological function of PTPase, nor is a ligand for PTPase, SDS is an effective denaturant to explore the conformation and activity of PTPase. Here, we used SDS to explore the activity and conformational transition of PTPase. Our result suggested the hydrophobic and electrostatic interactions between the residues around the active sites of PTPase and SDS were the major driving force to cause the inactivation and conformational transitions of PTPase. Therefore, the hydrophobic and charged residues around the active sites of PTPase are essential for the activity and conformation of PTPase. Our study facilitates a better understanding of PTPase conformation and activity.
Results
Effects of SDS on the activity of PTPase
To study the effects of SDS on the activity of PTPase, the residual activity of PTPase in the presence of 0–40 μM SDS was measured. The relationship of PTPase relative activity and SDS concentrations was determined, as shown in Fig. 1. The results showed the relative activity of PTPase declined gradually with the increase of SDS concentration. The relative activity of PTPase was 95% in the presence of 5 μM SDS. While increasing SDS concentration to 20 μM, the relative activity of PTPase decreased quickly from about 95% to 10%, indicating the conformation around the active sites of PTPase has been altered significantly by SDS. IC50 was estimated to be 11.27 μM by the extrapolation of the inactivation curve to x-axis. While further increasing SDS concentration more than 40 μM, PTPase activity continued to decrease slowly until it was abolished completely. The result suggested that SDS induced the conformational change of PTPase active sites in a concentration- dependent manner, thus resulting in the inactivation of PTPase.

The relation of the relative residue activity of PTPase and SDS concentration.
Intrinsic fluorescence spectra of PTPase in the presence of SDS
To determine the effect of SDS on the tertiary structure of PTPase, the intrinsic fluorescence spectra of PTPase in the presence of 0–100 μM SDS were collected. The result showed not only the maximum fluorescence emission intensity (Imax), but also the maximum emission wavelength (λmax) of PTPase had been changed by SDS (Fig. 2A). In the presence of 0–12.5 μM SDS, the fluorescence spectra of PTPase (curves 1–3 in Fig. 2A) were slightly changed. While increasing SDS concentration from 12.5 to 100 μM, the fluorescence spectra of PTPase (curves 3–6 in Fig. 2A) were changed significantly while compared to that of native PTPase.

(A) Intrinsic fluorescence spectra of PTPase in the presence of 0–100 μM SDS. SDS concentrations for curves 1–6 were 0, 6.25, 12.5, 25, 50 and 100 μM, respectively. Relative changes of Imax (B) and λmax (C) vs SDS concentration.
The relative changes of Imax and λmax of PTPase in the presence of SDS were plotted in Fig. 2B,C, respectively. The result showed Imax increased with the increase of SDS concentration from 0 to 100 μM, while compared to that of native PTPase. Imax increased not more than 10% in the presence of 0–12.5 μM SDS. While increasing SDS concentration to 50 μM, Imax increased about 40%. As shown in Fig. 2C, SDS induced a progressive blue-shift of λmax from 345 to 338 nm while gradually increasing SDS concentration from 0 to 50 μM. With further increasing SDS concentration to 100 μM, λmax continued to blue-shift from 338 to 335.5 nm.
ANS fluorescence spectra of PTPase in the presence of SDS
To study the effects of SDS on the hydrophobic patches of PTPase, ANS fluorescence spectra of PTPase in the presence of 0–50 μM SDS were collected. The result showed ANS itself had a very low level of fluorescence with λmax at 492 nm. Once binding with the hydrophobic patches of PTPase, λmax immediately blue-shifted to 476 nm. Also, Imax increased about 10-fold compared to that of free ANS (Fig. 3A). While increasing SDS concentrations to 50 μM, λmax slightly blue-shifted to 472.5 nm. In addition, Imax increased with the increase of SDS concentration (Fig. 3A). The relation of ANS fluorescence intensity and SDS concentrations was shown in Fig. 3B. Compared to that of native PTPase, Imax increased about 20% in the presence of 12.5 μM SDS. While increasing SDS concentration to 25 μM, Imax increased about 45%. In the presence of 50 μM SDS, Imax increased about 55%. These results suggested that SDS induced significant conformational transitions of PTPase, thus resulted in the exposure of the buried hydrophobic residues of PTPase.
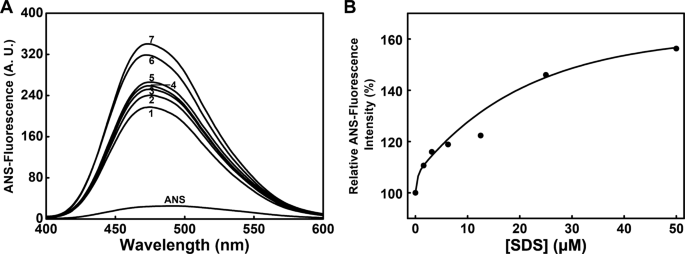
(A) ANS fluorescence spectra of PTPase in the presence of 0–50 μM SDS. SDS concentrations for curves 1–7 were 0, 1.56, 3.125, 6.25, 12.5, 25 and 50 μM, respectively. (B) Relative changes of Imax vs SDS concentration.
Far-UV circular dichroism spectra of PTPase in the presence of SDS
To reveal the effects of SDS on the secondary structures of PTPase, far-UV circular dichroism (CD) spectra of PTPase in the presence of 0–6 mM SDS were collected. The result showed the ellipticity of 222 nm (θ222) increased with increasing SDS concentration from 0 to 0.7 mM (Fig. 4A), indicating that SDS induced the formation of PTPase α-helical structure. θ222 increased about 18% in the presence of 1.8 mM SDS (Fig. 4B), indicating that SDS induced a significant conformational transition of PTPase, thus resulted in the increase of PTPase α-helical contents. While further increasing SDS concentration to 6 mM, θ222 decreased slightly about 3.5%, indicating a small portion of α-helixes of PTPase were likely induced by SDS to transform into other secondary structures.

(A) Far-UV CD spectra of PTPase in the presence of 0–6 mM SDS. SDS concentrations for curves from top to bottom were 0, 0.35, 0.70, 1.40, 1.80, 2.00, 2.40, 2.80, 3.00, 3.50, 4.00, 5.00, 5.50 and 6.00 mM, respectively. (B) Relative changes of the elipticity at 222 nm vs SDS concentration.
Structural analysis
Tt1001 from thermus thermophilus HB8 is same as PTPase of thermus thermophilus HB27, as they have 100% sequence identity25. To better understand the effects of SDS on PTPase activity and conformation, here we analyzed the structure of Tt1001. Tt1001 contains the signature motif P-loop consisted of the active-site sequence CLGNICRS (Fig. 5A). All the amide protons between Cys11 and Ser18 face the center of P-loop, and they are well positioned for the binding of PTPase with phosphate (Fig. 5A,B). Among of these residues, Cys11 and Cys16 are essential for the activity of PTPase. Arg17 also plays an important role for the substrate binding with PTPase (Fig. 5B)26,27,28. It is notable there is a crevice leading from one side into the active sites of Tt1001. The variable loop 3 links β2 and α2, which is adjacent to P-loop and the active sites. The variable loop 3 partially interacts with P-loop, thus stabilizing the conformation of PTPase active sites. The loop 5 connects α5 and α6, which also contains a critical residue Asp123 for PTPase activity (Fig. 5A,B).

(A) Cartoon structure of Tt1001 protein. α-helix, β-sheet and loops were colored in red, yellow and green, respectively. P-loop was highlighted in marine. (B) Essential residues Cys11, Cys16, Arg17 and Asp123 were showed as sticks. (C) Tryptophan and tyrosine residues were showed as sticks and lines, respectively. (D) Polar and charged residues located on loop 3 and loop 5 are showed as sticks. All the structures are prepared by PyMOL (DeLano, Warren L., The PyMOL Molecular Graphics System (2008). DeLano Scientific, California, USA).
As shown in Fig. 5C, Trp48, Trp137 and most of tyrosine residues are located on the surface of PTPase and exposed to solvents. Such exposure may lead to a lack of constraint of these residues in PTPase29. Among of the exposed aromatic residues, Trp48, Tyr125, and Tyr126 line around the crevice and near the active sites of PTPase. The side chains of these residues form a relatively hydrophobic microenvironment, which is favorable for the entrance and binding of phosphor-tyrosine with the active sites of PTPase (Fig. 5C)26,28. In addition, some polar and charged residues such as Thr45, His49, Glu52 are located on the loop 3 of PTPase and exposed to solvents. The side chains of these residues are positioned to face P-loop, which are important to maintain the conformation of PTPase active sites (Fig. 5D).
Discussion
Urea, GdnHCl and SDS are common chemical denaturants used to study the conformation-activity relation of an enzyme, however, they act in different ways. As a polar non-electrolyte, urea could form hydrogen bonds with peptide backbone, charged groups and water molecules in solution. The hydrogen bonds formation ability of urea is twice of water21,30. Hence, it is more efficient at breaking hydrogen bonds than hydrophobic interactions19,20. GdnHCl is able to reduce enzyme activity and improve protein molecules solubility. As a strong chaotrope, GdnHCl destroys the hydrogen bonds network of water and protein molecules, thus affecting the stability and activity of proteins in solution. Different from urea and GdnHCl, SDS consists of a 12-carbon tail and an anionic sulfate group, which endow SDS amphiphilic properties21,22. SDS interacts with proteins to form a negatively charged SDS-protein complex, thus disrupting the non-covalent interactions of protein chains23. Hence, SDS is widely applied in protein structural study to break the hydrophobic interactions, ionic bonds and hydrogen bonds22,24,31,32,33.
Our previous research has identified two different unfolding mechanism of PTPase in the presence of urea and GdnHCl. Urea and GdnHCl induce the unfolding of PTPase to form a partially active intermediate and an inactive intermediate, respectively25. Structural analysis, intrinsic and ANS fluorescence reveal that SDS also induces a compact denatured state like a molten globule state that has no significant change in the native secondary structure. The difference reflects the different mechanism of denaturants, which has been discussed in detail before. Urea (≤2.0 M) or GdnHCl (≤0.5 M) induces significantly a conformational transformation of PTPase, thus resulting in the loss of PTPase activity, the increase of α-helix structure and the formation of molten globule-like intermediate. Similarly, SDS (≤2.0 mM) induced the conformational change of PTPase active sites, decreased PTPase activity and increased PTPase α-helix content. The minimum concentrations required for the complete inactivation of PTPase for urea, GdnHCl and SDS are 8 M, 0.8 mM and 0.04 mM, respectively. The results suggest SDS is more efficient to inactivate PTPase activity than urea and GdnHCl, as SDS not only disrupts the hydrophobic interactions, but also breaks the hydrogen bonds and ionic bonds of PTPase.
Tryptophan residue usually has a maximal fluorescence emission wavelength at 340–350 nm when exposed to solvents34,35,36. The intrinsic fluorescence λmax of native PTPase was 345.5 nm (Fig. 2A), suggesting the tryptophan residues of PTPase likely exposed to solvents, which is consistent with the position of Trp48 and Trp137 in Tt1001 (Fig. 5C). In the presence of tryptophan residue, tyrosine fluorescence is often negligible due to their significant fluorescence ability differences. However, we noticed some slight changes in the intrinsic fluorescence spectra between 300 and 310 nm (curves 3–6 in Fig. 2A), which may come from the fluorescence emission of the exposed tyrosine residues37. As shown in Fig. 2B,C, λmax blue-shifted about 10 nm along with the increase of Imax in the presence of 100 μM SDS, indicating these exposed tryptophan and tyrosine residues of PTPase probably were induced by SDS into a relatively hydrophobic microenvironment38. This transition may arise from the hydrophobic interactions between the tryptophan and tyrosine residues of PTPase and the aliphatic chain of SDS. Morin is known to be easily extracted into SDS micelles through hydrophobic interaction39. Imax decreased with the increase of SDS concentration, which may be due to the fluorescence quenching caused by high concentration SDS37.
The ANS fluorescence spectra of PTPase showed that λmax blue-shifted and Imax increased along with the increase of SDS concentration (Fig. 3A,B), indicating more and more ANS bound with the hydrophobic residues of PTPase40. The exposure of the hydrophobic residues probably arose from the conformational transition induced partially by the hydrophobic interactions of PTPase and SDS41. As shown in Fig. 5, the hydrophobic residues are located on the flexible loops, which are near the active sites of PTPase and may be involved in the interactions of PTPase with SDS.
The far-UV CD spectra of PTPase suggested SDS induced the formation of α-helical structure (Fig. 4B)42,43. In addition to the hydrophobic interactions, the ionic bonds interactions between the anionic “head” of SDS and the exposed charged residues of PTPase such as Thr45, His49, Glu52 and Asp55 may also be involved in the conformational transitions of PTPase induced by SDS (Fig. 5D). The hydrophobic and ionic bonds interactions between SDS and PTPase probably induced the conformational transitions of PTPase, thus resulted in the formation of PTPase α-helix structure. In our previous study, we have discussed the effect of the charged residues around the active sites on PTPase activity. The ionic bonds interactions between Gdn+ and the charged residues disrupt the conformation of PTPase active sites, resulting in the inactivation of PTPase25. Here, our result again suggested the hydrophobic and charged residues around the active sites are essential for the conformation and activity of PTPase.
Based on the structure of Tt1001 and our findings, we suggest the flexible loops of PTPase, especially loop 3 and loop 5, contain a number of essential residues for the conformation of the active sites and substrate binding of PTPase. The hydrophobic and charged residues in the loops may interact with SDS via the hydrophobic and electrostatic interactions to induce the conformational changes of the loops, thus resulting in a slight decrease of PTPase activity in the presence of 0–5 μM SDS (Fig. 1). With the increase of SDS concentration and the conformational changes of these loops, the conformation of P-loop was gradually induced to expose to solvents, which possibly led to a direct interaction of P-loop with SDS. The interactions of P-loop and SDS further altered the conformation of PTPase active sites, resulting in the rapid loss of PTPase activity in the presence of 5–20 μM SDS. While further increasing SDS concentration, PTPase activity continued to decrease until the conformation of PTPase active sites was changed completely (Fig. 1). Meanwhile, the variable loops or other structures of PTPase were possibly induced by SDS to transform into α-helical structure (Fig. 4). These conformational transitions caused the exposure of the hydrophobic residues such as Trp48, Tyr125 and Tyr126 buried in the interior of PTPase, thus determined the intrinsic and ANS fluorescence spectra changes (Figs. 2, 3).
Although we have discussed the conformational transitions and the inactivation of PTPase induced by SDS in detail, more experimental evidences such as the complex structure of PTPase-SDS and the dynamics of PTPase-SDS interactions are still required to clarify the details of molecular interaction. Our study is valuable toward the long-term goal to better understand the activity and conformation of PTPase.
Materials and Methods
Reagents and materials
All chemicals used in this research such as para-nitrophenyl phosphate (pNPP), Isopropyl-β-D-1-thiogalactopyranoside (IPTG), Dithiothreitol (DTT), SDS and 1-anilinonaphtalene-8-sulfonate (ANS) were of the highest purity commercially available. PTPase from thermus thermophilus HB27 was cloned into pET-28a (+) vector (Novagen, Germany) and overexpressed in E. coli BL21 (DE3). PTPase was purified as described12. The concentration of recombinant PTPase was determined by BCA protein assay kit (Pierce, USA).
PTPase activity assay
PTPase activity was assayed as described previously25,44. Briefly, pNPP (10 mM) and PTPase (2.4 μM) were added into 200 µL, 50 mM acetic acid-sodium acetate buffer (pH 3.8) plus 5 mM DTT. After incubation at 30 °C for 10 min, NaOH (1 M, 1 mL) was added into the mixture to terminate the reaction. The absorption change at 405 nm was recorded on a Helios-γ UV-VIS spectrophotometer (Thermo Scientific, USA). The residual activities of PTPase were measured after incubation of PTPase with variable concentrations of SDS at 25 °C for 2 h.
Intrinsic and ANS fluorescence spectra
The intrinsic fluorescence spectra of PTPase in the presence of SDS were recorded on a F-2500 fluorescence spectrophotometer (Hitachi, Japan) at 25 °C, which is equipped with a water-circulating bath with an accuracy ± 0.10 °C. The intrinsic fluorescence spectra were excited at 280 nm and recorded from 300 and 400 nm using a 1 cm path-length quartz cuvette. ANS was used as a fluorescent probe to study the conformational changes of PTPase in the presence of various concentrations SDS. After addition of 10-folds molar excess of ANS into PTPase in the presence of 0–50 μM SDS, the samples were incubated at 25 °C for 30 min in dark prior to the tests. The ANS fluorescence emission spectra were excited at 380 nm and collected from 400 to 600 nm at 25 °C. All fluorescence spectra of PTPase were calibrated by subtraction of the fluorescence of SDS under the same experimental condition. Final spectra were the average of three corrected spectra. PTPase concentration was 2.4 μM for all the intrinsic and ANS fluorescence experiments.
Far-UV CD spectra
The far-UV CD spectra of PTPase in the presence of SDS were recorded on a J-715 spectrophotometer (Jasco, Japan) at 25 °C with a thermostatically controlled cell holder attached to a water bath with an accuracy ± 0.10 °C. The CD spectra were collected from 250 to 190 nm using a 1 cm path-length quartz cuvette. Five spectra were collected for each sample and averaged after subtraction the signal of SDS under the same condition. The final concentration of PTPase was 11 μM for all CD experiments.
References
Den Hertog, J. Protein-tyrosine phosphatases in development. Mech. Dev. 85, 3–14, https://doi.org/10.1016/S0925-4773(99)00089-1 (1999).
Hunter, T. Signaling–2000 and beyond. Cell 100, 113–127, https://doi.org/10.1016/s0092-8674(00)81688-8 (2000).
Hunter, T. Protein kinases and phosphatases: the yin and yang of protein phosphorylation and signaling. Cell 80, 225–236, https://doi.org/10.1016/0092-8674(95)90405-0 (1995).
Denu, J. M. & Dixon, J. E. Protein tyrosine phosphatases: mechanisms of catalysis and regulation. Curr. Opin. Chem. Biol. 2, 633–641, https://doi.org/10.1016/S1367-5931(98)80095-1 (1998).
Den Hertog, J., Ostman, A. & Bohmer, F. D. Protein tyrosine phosphatases: regulatory mechanisms. FEBS J. 275, 831–847, https://doi.org/10.1111/j.1742-4658.2008.06247.x (2008).
Wang, W. Q., Sun, J. P. & Zhang, Z. Y. An overview of the protein tyrosine phosphatase superfamily. Curr. Top. Med. Chem. 3, 739–748, https://doi.org/10.2174/1568026033452302 (2003).
Pils, B. & Schultz, J. Evolution of the multifunctional protein tyrosine phosphatase family. Mol. Biol. Evol. 21, 625–631, https://doi.org/10.1093/molbev/msh055 (2004).
Hendriks, W. J., Elson, A., Harroch, S. & Stoker, A. W. Protein tyrosine phosphatases: functional inferences from mouse models and human diseases. FEBS J. 275, 816–830, https://doi.org/10.1111/j.1742-4658.2008.06249.x (2008).
Jia, Z., Barford, D., Flint, A. J. & Tonks, N. K. Structural basis for phosphotyrosine peptide recognition by protein tyrosine phosphatase 1B. Sci. 268, 1754–1758, https://doi.org/10.1126/science.7540771 (1995).
Tonks, N. K. Protein tyrosine phosphatases: from genes, to function, to disease. Nat. Rev. Mol. Cell Biol. 7, 833–846, https://doi.org/10.1038/nrm2039 (2006).
Henne, A. et al. The genome sequence of the extreme thermophile Thermus thermophilus. Nat. Biotechnol. 22, 547–553, https://doi.org/10.1038/nbt956 (2004).
Wang, Y., Meng, F. & Zhang, Y. Expression, purification and characterization of recombinant protein tyrosine phosphatase from Thermus thermophilus HB27. Acta Biochim. Biophys. Sin. 41, 689–698, https://doi.org/10.1093/abbs/gmp057 (2009).
Vazquez-Perez, A. R. & Fernandez-Velasco, D. A. Pressure and denaturants in the unfolding of triosephosphate isomerase: the monomeric intermediates of the enzymes from Saccharomyces cerevisiae and Entamoeba histolytica. Biochem. 46, 8624–8633, https://doi.org/10.1021/bi061879j (2007).
Chaitanya, P. K. & Prabhu, N. P. Stability and activity of porcine lipase against temperature and chemical denaturants. Appl. Biochem. Biotechnol. 174, 2711–2724, https://doi.org/10.1007/s12010-014-1220-8 (2014).
Si, Y. X. et al. Purification, characterization, and unfolding studies of arginine kinase from Antarctic krill. Int. J. Biol. Macromol. 67, 426–432, https://doi.org/10.1016/j.ijbiomac.2014.03.044 (2014).
Wang, Z. J. et al. A folding study of Antarctic krill (Euphausia superba) alkaline phosphatase using denaturants. Int. J. Biol. Macromol. 70, 266–274, https://doi.org/10.1016/j.ijbiomac.2014.07.001 (2014).
Siddiqui, M. F. & Bano, B. Insight into the functional and structural transition of garlic phytocystatin induced by urea and guanidine hydrochloride: A comparative biophysical study. Int J Biol Macromol 106, https://doi.org/10.1016/j.ijbiomac.2017.07.172 (2017).
Chen, S. et al. Biophysical and structural characterization of the thermostable WD40 domain of a prokaryotic protein, Thermomonospora curvata PkwA. Scientific Reports (2018).
Zhou, P., Liu, X. & Labuza, T. P. Moisture-induced aggregation of whey proteins in a protein/buffer model system. J. Agric. Food Chem. 56, 2048–2054, https://doi.org/10.1021/jf073151v (2008).
Manoi, K. & Rizvi, S. S. H. Physicochemical changes in whey protein concentrate texturized by reactive supercritical fluid extrusion. J. Food Eng. 95, 627–635, https://doi.org/10.1016/j.jfoodeng.2009.06.030 (2009).
Liu, K. & Hsieh, F. H. Protein-protein interactions during high-moisture extrusion for fibrous meat analogues and comparison of protein solubility methods using different solvent systems. J. Agric. Food Chem. 56, 2681–2687, https://doi.org/10.1021/jf073343q (2008).
Jain, R., Sharma, D., Kumar, R. & Kumar, R. Structural, kinetic and thermodynamic characterizations of SDS-induced molten globule state of a highly negatively charged cytochrome c. J. Biochem. 165, 125–137, https://doi.org/10.1093/jb/mvy087 (2019).
Jung, J. M., Savin, G., Pouzot, M., Schmitt, C. & Mezzenga, R. Structure of heat-induced beta-lactoglobulin aggregates and their complexes with sodium-dodecyl sulfate. Biomacromolecules 9, 2477–2486, https://doi.org/10.1021/bm800502j (2008).
Homouz, D. M., Zegarra, F. C., Eliaz, Y. & Cheung, M. S. Is Hydroydrodynamic Interaction Important to Protein Folding? Biophys. J. 114, 52a, https://doi.org/10.1016/j.bpj.2017.11.339 (2018).
Wang, Y. et al. Inactivation and unfolding of protein tyrosine phosphatase from Thermus thermophilus HB27 during urea and guanidine hydrochloride denaturation. PLoS One 9, e107932, https://doi.org/10.1371/journal.pone.0107932 (2014).
Madhurantakam, C. et al. Crystal structure of low-molecular-weight protein tyrosine phosphatase from Mycobacterium tuberculosis at 1.9-A resolution. J. Bacteriol. 187, 2175–2181, https://doi.org/10.1128/JB.187.6.2175-2181.2005 (2005).
Yang, J. et al. Crystal structure of the catalytic domain of protein-tyrosine phosphatase SHP-1. J. Biol. Chem. 273, 28199–28207, https://doi.org/10.1074/jbc.273.43.28199 (1998).
Das, A. K., Helps, N. R., Cohen, P. T. & Barford, D. Crystal structure of the protein serine/threonine phosphatase 2C at 2.0 A resolution. EMBO J. 15, 6798–6809, https://doi.org/10.1002/j.1460-2075.1996.tb01071.x (1996).
Lakowicz, J. R., Maliwal, B. P., Cherek, H. & Balter, A. Rotational freedom of tryptophan residues in proteins and peptides. Biochem. 22, 1741–1752, https://doi.org/10.1021/bi00277a001 (1983).
O’Brien, E. P., Dima, R. I., Brooks, B. & Thirumalai, D. Interactions between hydrophobic and ionic solutes in aqueous guanidinium chloride and urea solutions: lessons for protein denaturation mechanism. J. Am. Chem. Soc. 129, 7346–7353, https://doi.org/10.1021/ja069232+ (2007).
Gelamo, E. L. & Tabak, M. Spectroscopic studies on the interaction of bovine (BSA) and human (HSA) serum albumins with ionic surfactants. Spectrochim. Acta A Mol. Biomol. Spectrosc. 56A, 2255–2271, https://doi.org/10.1016/s1386-1425(00)00313-9 (2000).
Caetano, W., Gelamo, E. L., Tabak, M. & Itri, R. Chlorpromazine and sodium dodecyl sulfate mixed micelles investigated by small angle X-ray scattering. J. Colloid Interface Sci. 248, 149–157, https://doi.org/10.1006/jcis.2001.8164 (2002).
Otzen, D. Protein-surfactant interactions: a tale of many states. Biochim. Biophys. Acta 1814, 562–591, https://doi.org/10.1016/j.bbapap.2011.03.003 (2011).
Dijkstra, D. S. et al. A fluorescence study of single tryptophan-containing mutants of enzyme IImtl of the Escherichia coli phosphoenolpyruvate-dependent mannitol transport system. Biochem. 35, 6628–6634, https://doi.org/10.1021/bi952222t (1996).
He, H. W., Feng, S., Pang, M., Zhou, H. M. & Yan, Y. B. Role of the linker between the N- and C-terminal domains in the stability and folding of rabbit muscle creatine kinase. Int. J. Biochem. Cell Biol. 39, 1816–1827, https://doi.org/10.1016/j.biocel.2007.04.028 (2007).
Chen, Z. et al. Chaperone-like effect of the linker on the isolated C-terminal domain of rabbit muscle creatine kinase. Biophys. J. 103, 558–566, https://doi.org/10.1016/j.bpj.2012.07.002 (2012).
Deshpande, S. S. & Damodaran, S. Denaturation behavior of phaseolin in urea, guanidine hydrochloride, and sodium dodecyl sulfate solutions. J. Protein Chem. 10, 103–115, https://doi.org/10.1007/BF01024660 (1991).
Chang, L. S., Wen, E. Y., Hung, J. J. & Chang, C. C. Energy transfer from tryptophan residues of proteins to 8-anilinonaphthalene-1-sulfonate. J. Protein Chem. 13, 635–640, https://doi.org/10.1007/bf01890462 (1994).
Liu, W. & Guo, R. Interaction between morin and sodium dodecyl sulfate (SDS) micelles. J. Agric. Food Chem. 53, 2890–2896, https://doi.org/10.1021/jf047847p (2005).
Li, S., Wang, L. T. & Zhou, H. M. SDS-induced conformational changes and inactivation of the bacterial chaperonin GroEL. J. Protein Chem. 18, 653–657, https://doi.org/10.1023/a:1020650105969 (1999).
Lu, W. et al. Inactivation and dissociation of rice ribulose-1,5-bisphosphate carboxylase/oxygenase during denaturation by sodium dodecyl sulfate. Biochem. 67, 940–944, https://doi.org/10.1023/a:1019978923575 (2002).
D’Auria, S. et al. Structural characterization and thermal stability of Notothenia coriiceps metallothionein. Biochem. J. 354, 291–299, https://doi.org/10.1042/0264-6021:3540291 (2001).
Pertinhez, T. A., Bouchard, M., Smith, R. A., Dobson, C. M. & Smith, L. J. Stimulation and inhibition of fibril formation by a peptide in the presence of different concentrations of SDS. Febs Lett. 529, 193–197, https://doi.org/10.1016/S0014-5793(02)03333-1 (2002).
Zhang, Z. Y. & VanEtten, R. L. Pre-steady-state and steady-state kinetic analysis of the low molecular weight phosphotyrosyl protein phosphatase from bovine heart. J. Biol. Chem. 266, 1516–1525 (1991).
Acknowledgements
This project was supported by the National Natural Science Foundation of China (31972622), the State Key Program of the National Natural Science of China (31530071), the Fundamental Research Funds for the Central Universities (XDJK2020TJ001, XDJK2020C049, 3102019YX01002) and the Open Project Program of Chongqing Engineering and Technology Research Center for Novel Silk Materials (silkgczx2016003).
Author information
Authors and Affiliations
Contributions
Y.W. and H.H. (Huawei He) conceived and designed the experiments; H.H. (Hai Hou) and Y.W. performed the experiments; Y.W. and H.H. (Huawei He) analyzed the data; Y.W. and H.H. (Huawei He) contributed reagents/materials/analysis tools; Y.W. and H.H. (Huawei He) wrote the draft and revised the manuscript; Y Y.W. and H.H. (Huawei He) supervised the research. All authors reviewed the manuscript.
Corresponding authors
Ethics declarations
Competing interests
The authors declare no competing interests.
Additional information
Publisher’s note Springer Nature remains neutral with regard to jurisdictional claims in published maps and institutional affiliations.
Rights and permissions
Open Access This article is licensed under a Creative Commons Attribution 4.0 International License, which permits use, sharing, adaptation, distribution and reproduction in any medium or format, as long as you give appropriate credit to the original author(s) and the source, provide a link to the Creative Commons license, and indicate if changes were made. The images or other third party material in this article are included in the article’s Creative Commons license, unless indicated otherwise in a credit line to the material. If material is not included in the article’s Creative Commons license and your intended use is not permitted by statutory regulation or exceeds the permitted use, you will need to obtain permission directly from the copyright holder. To view a copy of this license, visit http://creativecommons.org/licenses/by/4.0/.
About this article

Cite this article
Hou, H., He, H. & Wang, Y. Effects of SDS on the activity and conformation of protein tyrosine phosphatase from thermus thermophilus HB27. Sci Rep 10, 3195 (2020). https://doi.org/10.1038/s41598-020-60263-4
Received:
Accepted:
Published:
DOI: https://doi.org/10.1038/s41598-020-60263-4
This article is cited by
-
Efficient Expression and Characterization of an Endo-Type Lyase HCLase_M28 and Its Gradual Scale-Up Fermentation for the Preparation of Chondroitin Sulfate Oligosaccharides
Applied Biochemistry and Biotechnology (2024)
-
Effects of tannic acid on proteins and fat in cream
Food Production, Processing and Nutrition (2023)
-
Trimer stability of Helicobacter pylori HtrA is regulated by a natural mutation in the protease domain
Medical Microbiology and Immunology (2023)
-
Effects of Sodium Dodecyl Sulfate on the Enzyme Catalysis and Conformation of a Recombinant γ-Glutamyltranspeptidase from Bacillus licheniformis
The Protein Journal (2023)
Comments
By submitting a comment you agree to abide by our Terms and Community Guidelines. If you find something abusive or that does not comply with our terms or guidelines please flag it as inappropriate.
