
Abstract
Cannabis sativa L., previously concealed by prohibition, is now a versatile and promising plant, thanks to recent legalization, opening doors for medical research and industry growth. However, years of prohibition have left the Cannabis research community lagging behind in understanding Cannabis genetics and trait inheritance compared to other major crops. To address this gap, we conducted a comprehensive genome-wide association study (GWAS) of nine key agronomic and morphological traits, using a panel of 176 drug-type Cannabis accessions from the Canadian legal market. Utilizing high-density genotyping-by-sequencing (HD-GBS), we successfully generated dense genotyping data in Cannabis, resulting in a catalog of 800 K genetic variants, of which 282 K common variants were retained for GWAS analysis. Through GWAS analysis, we identified 18 markers significantly associated with agronomic and morphological traits. Several identified markers exert a substantial phenotypic impact, guided us to putative candidate genes that reside in high linkage-disequilibrium (LD) with the markers. These findings lay a solid foundation for an innovative cannabis research, leveraging genetic markers to inform breeding programs aimed at meeting diverse needs in the industry.
Introduction
Cannabis (Cannabis sativa L.), an annual and dioecious plant species belonging to the Cannabaceae family, stands as one of the earliest domesticated plants. Its rich history is intertwined with the socioeconomic and cultural development of human societies1,2. This versatile crop has served a multitude of purposes, offering valuable fibers for ropes and nets, abundant production of protein- and oil-rich seeds, applications in traditional medicine dating back to approximately 8000 BCE, and psychoactive properties3. Here, when referring to the plant, we will use its scientific genus name, Cannabis. In Canada, the trajectory of Cannabis cultivation took a significant turn, transitioning from a 1920s prohibition to the legalization of hemp cultivation in 1998, followed by the authorization of medical use in 2001 and recreational use in 20184,5. Despite the fact that Cannabis is known to produce over 545 potentially bioactive secondary metabolites6, in Canada, the USA and the Europe, it is legally categorised based on the concentration of a single cannabinoid, the Δ9-tetrahydrocannabinol (THC), present in the trichomes of female flowers7. Cannabis plants with less than 0.3% total THC are classified as hemp-type, while those with greater than 0.3% total THC (calculated as (Tetrahydrocannabinolic acid × 0.877) + THC) are labeled as drug-type Cannabis. The shift in legislation has fueled the development of diverse industries, significantly contributing to Canada's gross domestic product (GDP) and job market, injecting approximately $43.5 billion into the economy and creating over 151,000 jobs in four years (2018–2022)8. The historical and societal significance of Cannabis is undeniable, and recent changes in legislation worldwide have propelled it into the forefront of scientific investigation, research and development9. Since the discovery of THC in 1964, extensive efforts have been made to characterize the metabolome of hundreds of Cannabis plants, leading to discovery of over 150 terpenoids, 120 cannabinoids and various flavonoids10,11. Likewise, there have been substantial strides in unraveling the Cannabis genome and creating a worldwide C. sativa genomics resource3,12,13,14. Notably, significant progress in Cannabis genome assembly has been achieved through the utilization of long-read sequencing technologies (i.e., PacBio and Oxford Nanopore Technologies) coupled with scaffold anchoring with genetic linkage maps and the integration of Hi-C data. These advancements have led to the development of four chromosome-level assemblies15,16. Among them, the cs10 v2 assembly (GenBank acc. no. GCA_900626175.2) is considered as the most complete and has been proposed as the reference genome for Cannabis by the International Cannabis Research Consortium (ICGRC)17. In this assembly, the C. sativa has been estimated to be around 875.7 Mb, characterized by a pair of sex chromosomes and nine autosomes, comprising 31,170 annotated genes13. The de novo assembly of Cannabis genomes was fraught with challenges due to a substantial level of heterozygosity (ranging from approximately 12.5–40.5%), and a remarkable abundance of repetitive elements, accounting for roughly 70% of the genome3. The in-depth characterization of the metabolome and genome of C. sativa provided new opportunities for medical research, industrial growth and the development of modern agronomic practices.
Despite progress such as increasing cannabinoid concentration, the twentieth century prohibition of Cannabis has hindered its cultivation from fully benefiting from the tools introduced during the Green Revolution5. For many years, Cannabis breeding occurred in clandestine operations, relying on undocumented methods and a dearth of modern technologies. Similar to other high-value crops, modern breeding technologies hold the promise of enhancing Cannabis traits to meet diverse needs, spanning manufacturing, medicinal, recreational, and culinary uses18. The cannabis research community is hugely undersized and suffers from a scarcity of understanding of Cannabis genetics and how key traits are expressed or inherited19. Thus, a better understanding of the genetic basis of agronomic and morphological traits of drug-type Cannabis appears to be a prerequisite for the development of improved Cannabis varieties, optimizing cultivation practices, and conserving valuable genetic resources3.
The advent of next-generation sequencing technology (NGS)20, which offers cost-effective high-throughput sequencing, coupled with the availability of powerful bioinformatic tools21,22, have facilitated the widespread adoption of genotype–phenotype association studies to investigate the relationship between genetic variation and phenotypic traits for a wide range of crops23. Recent classic quantitative trait loci (QTL) mapping studies have enabled identification of maturity-related QTL in both hemp24 and drug-type Cannabis25. Classic QTL mapping analysis defines molecular markers linked to a phenotype segregating within parental lines, in contrast to modern genome-wide association studies (GWAS) which identify loci related to phenotypes within large populations of unrelated individuals23. GWAS use the information of linkage disequilibrium (LD) between a QTL and neighboring genetic markers to identify the regions on the genome that influence traits. However, when applied to a large set of individuals, the sequencing cost remains the most limiting factor, especially in heterozygous organisms like Cannabis where a high sequencing depth per sample is needed to accurately determine genotypes26. To address this challenge, cost-effective high-throughput genotyping methods (e.g., restriction-site associated DNA sequencing (RAD-Seq)27, genotyping-by-sequencing (GBS)28 and High-Density GBS (HD-GBS)29, based on reduced-representation sequencing approaches (RRS)30, have been developed. Recent GWAS studies in hemp-type Cannabis31,32,33 to investigate fiber quality, flowering time and sex determination and drug-type Cannabis34 to investigate genetic basis of terpenes have enabled identification of significant genetic markers. The newly identified QTL will enable the early selection of promising individuals through marker-assisted selection (MAS)35, thereby reducing the labor and costs associated with development of improved varieties. Genetic association studies are, therefore, of significant value in advancing breeding programs towards molecular approaches23.
While flowering time and sex determination have been focal points in Cannabis breeding, the genetic basis of other important agronomic traits (e.g., yield, height, days to maturity, etc.) remain largely unexplored. Morphological traits should be duly considered due to their established intercorrelations with yield, maturity and cannabinoid profiles36. For instance, Cannabis plants cultivated for medicinal and recreational application exhibit shorter stature, have thinner stems, more nodes, higher floral density, and a different cannabinoid profiles compared to industrial hemp plants37. On the other hand, genetic backgrounds that prioritize yield may negatively impact THC production, and vice versa36. Investigating genetic variations associated with agronomic and morphological traits is essential for establishing the genetic groundwork for developing tailor-made Cannabis varieties, along with breeding tools such as MAS and genomic selection (GS)38.
To facilitate the development of molecular tools for Cannabis breeders and researchers, the present study provides high-value markers linked to essential agronomic and morphological traits, identified through GWAS conducted on 176 drug-type Cannabis accessions from the Canadian legal market. Markers associated with essential traits were identified using the multi-locus statistical method Bayesian-information and linkage-disequilibrium iteratively nested keyway (BLINK)39. In summary, this study lays the groundwork for a comprehensive understanding of the genetic foundations underpinning the agronomic and morphological traits in Cannabis. The markers identified through this research promise to significantly expedite breeding efforts, empowering us to cultivate Cannabis varieties optimized for various purposes and applications.
Experimental procedures
Plant material and phenotyping data
All research activities, including the procurement and cultivation of Cannabis plants, were executed in accordance with our Cannabis research license (LIC-QX0ZJC7SIP-2021) and in full compliance with Health Canada’s regulations. In total, in this study, we used 176 drug-type accessions each accompanied by phenotyping data sourced from Lapierre et al.1. These accessions were selected from diverse sources to ensure representation of the broad spectrum of the drug-type Cannabis varieties available in the legal market of Canada (Supplementary Table S1).
In this study, we used four key productivity-related traits, including fresh biomass (FB; whole Cannabis plant excluding the roots), dried flower weight (DFW; representing yield), sexual maturity (SM; defined as the stage at which the first floral bud could be observed at the base of an axillary stem prior to the initiation of flowering) and harvest maturity (HM; days to maturity). Additionally, we included five morphological traits, namely stem diameter (SD), canopy diameter (CD), height, internode length index (ILI) and node counts (NC). It is worth noting that values were originally recorded in inches and were converted to centimeter for consistency. Histograms representing the distribution of each trait for the 176 accessions were generated using R v4.2.140 with the ‘hist’ function. Furthermore, a t-test was performed to determine whether the minimum and maximum values of each trait significantly differed from the overall population mean.
Sequencing and genotyping
DNA isolation, library preparation and sequencing
Approximately 50 mg of young leaf tissue from each accession was collected for DNA extraction. The collected leaf tissues were air-dried for four days using a desiccating agent (Drierite; Xenia, OH, USA) and then ground with metallic beads in a RETSCH MM 400 mixer mill (Fisher Scientific, MA, USA). DNA extraction was carried out using the CTAB-chloroform protocol41. In brief, the powdered tissue was treated with a CTAB buffer solution, followed by a phenol–chloroform extraction procedure. The resulting DNA pellet underwent ethanol washing and was subsequently re-suspended in water. DNA quantification was carried out using a Qubit fluorometer with the dsDNA HS assay kit (Thermo Fisher Scientific, MA, USA), and concentrations were adjusted to 10 ng/μl for all samples. Final DNA samples were used to prepare HD-GBS libraries with BfaI as described in Torkamaneh et al.29 at the Institut de biologie intégrative et des systèmes (IBIS), Université Laval, QC, Canada. Sequencing was conducted on an Illumina NovaSeq 6000 (Illumina, CA, USA) with 150 paired-end reads at the Genome Quebec Service and Expertise Center (CESGQ), Montreal, QC, Canada.
SNP calling and filtration
Sequencing data were processed with the Fast-GBS v2.042 using the C. sativa cs10 v2 reference genome (GenBank acc. no. GCA_900626175.2)15. For variant calling a prerequisite of a minimum of 6 reads to call a single nucleotide polymorphism (SNP) was opted. Raw SNP data were filtered with VCFtools v0.1.1643 to remove low-quality SNPs (QUAL < 10 and MQ < 30) and variants with proportion of missing data exceeding 80%. Missing data imputation was performed with BEAGLE 4.144, followed by a second round of filtration, retaining only biallelic variants with heterozygosity less than 50% and a minor allele frequency (MAF) of > 0.06. Additionally, variants residing on unassembled scaffolds were removed. The resulting catalog of ~ 282 K SNPs was used to conducted genetic analysis, population structure assessment and GWAS (Supplementary Tables S2).
Genetic analysis
Marker description
Read counts and coverage were calculated with SAMtools “coverage” parameter45. Proportion of heterozygous variants and MAF were estimated using TASSEL546. The proportion of SNPs located within annotated genes was determined with BEDTools47 by analyzing the number of SNPs overlapping with gene regions48 (Supplementary Table S3). To visualize the distribution of SNP density, a plot was produced with rMVP22 using ‘plot.type = ”d”’ parameter, in combination with the gene density distribution. The nucleotide diversity (π)49 was measured in a sliding windows of 1000 bp across the genome using—window‐pi option of VCFtools43. Similarly, the pairwise π was calculated among different clusters.
LD decay and Haplotype block
Pairwise-LD was calculated with PLINK v1.950 using ‘–r2 –ld-window-r2 0’ parameters. Long-range LD, measured as the allele frequency correlation (r2), was determined for all pairwise SNPs within each chromosome independently (Supplementary Table S3). The LD decay curve line was fitted on the scatterplot using the smoothing spline regression following the procedure of Remington et al.51 in the R environment (Fig. 2b). The point of intersection between the LD curve and the predefined r2 threshold determined the LD decay. Estimation of haplotype blocks (HBs) was performed with PLINK v1.9 using ‘–blocks no-pheno-req –ld-window-kb 999’. A t-test was conducted in R to assess whether the LD decay of the chromosome X significantly differed from that of other chromosomes.
Population structure analysis
Population structure and admixture
Population admixture was determined using a variational Bayesian inference algorithm implemented in fastStructure v1.052 for a number of subpopulations (K) set from 1 to 10. The optimal number of K (i.e., 3) explaining the population complexity was estimated using the ChooseK tool from fastStructure and admixture proportions were visualized using Distruct v2.3 (Fig. 2c, Supplementary Fig. S1). The kinship matrix (K*) was generated using TASSEL5 with the Centered_IBS method and plotted with GAPIT v321 (Supplementary Fig. S3).
Discriminant analyses of principal components (DAPC) for population structure
Population structure was further investigated using discriminant analyses of principal components (DAPC)53 using the R package ‘adegenet’ version 2.1.10. The number of cluster was estimated using ‘find.cluster’ function with a maximum limit set to 40 clusters and 200 principal components (PCs) (Fig. 2d). Optimal number of clusters (i.e., K = 3) was determined by the minimal Bayesian Information Criterion (BIC) value for different numbers of K (Supplemental Fig. S2ab). To visualize the DAPC using the ‘scatter’ function, the optimal number of PCs was estimated with two cross-validation procedures using ‘optim.a.score’ (i.e., PCs = 20, Supplemental Fig. S2c) and ‘xvalDapc’ (i.e., PCs ≤ 20, Supplemental Fig. S2d).
Comparison of population assignments and trait analysis
Cluster assignments from both fastStructure and DAPC were compared using the ‘table’ function for a K value of 3 and 6 (Supplementary Fig. S4). An analysis of variance (ANOVA) and permutational ANOVA (PERMANOVA) were performed for traits following and deviating from the normal distribution, respectively, using the ‘adonis2’ function from R package ‘vegan’. Cluster assignments obtained from fastStructure were used as covariate. In cases where ANOVA/PERMANOVA indicated a significant difference, the post-hoc Tukey honestly significant difference (HSD) test was performed to determine which pairs were significantly different. Violin plots were generated with ‘ggplot2’ in R and Tukey significant differences were represented by letter (Supplementary Fig. S5).
Genome-wide association analysis
Marker-trait association analysis was performed using the method BLINK39 in GAPIT v321, using the 282 K high-quality SNPs and the phenotyping data for nine different traits. The identification of false positive was minimized by incorporating population structure (i.e., P matrix generated with fastStructure for K = 3) and kinship (i.e., K* matrix generated with TASSEL5) for the analysis. The threshold of significance for marker-trait associations in both methods was set to ensure a false discovery rate < 0.05, adjusted with a Benjamini–Hochberg correction. Markers with a phenotypic variance explained (PVE) less than 3% were excluded from the analysis as they were considered uninformative and of limited interest. Manhattan plots showing –log10(p) distribution of markers by chromosome were generated with rMVP22 using ‘plot.type = ”m”’ and quantile–quantile (QQ) plots were created with GAPIT v321 (Supplementary Fig. S6). Boxplot of the allelic classes of significant markers were generated with ‘ggplot2’ in R (Supplementary Fig. S7).
Preliminary candidate gene identification
Due to the substantial genetic diversity present in Cannabis, only a limited number of SNPs exhibited a strong LD (r2 ≥ 0.95). Therefore, to pinpoint genetic regions of interest, only markers in high LD (r2 ≥ 0.75) with significant markers were retained to define haplotype blocks (HBs). Markers failing to form HB and residing outside of genetic regions were removed from the candidate gene investigation. Genes located in the HBs (defined by the 5ʹ-most and 3ʹ-most marker of the HB) were considered as putative candidate genes. The gene ontology (GO) annotations of these candidate genes were examined based on the description provided by the NCBI Cannabis sativa Annotation Release 100. To further confirm and provide a more detailed functional annotation of candidate genes, phylogenetic ortholog inferences were performed using OrthoFinder54 with the Arabidopsis thaliana transcriptome (TAIR 11)55.
Results and discussion
A broad range of phenotypic variation among the 176 drug-type accessions
The population displayed significant phenotypic diversity (p < 0.001) across the nine examined traits (Fig. 1, Supplemental Table S1). For instance, FB exhibited a substantial variation, ranging from 90 to 1260 g, while plant height varied between 22 and 109 cm. SM also showed a significant diversity, with individuals initiating the first flower bud between 20 and 68 days. With the exception of SM, all other traits displayed a unimodal distribution, suggesting a complex genetic control involving multiple QTL. Furthermore, these traits exhibited highly skewed distributions, indicating that some accessions may carry specific alleles or combinations of alleles exerting a substantial impact on these traits. This phenotypic diversity within the Cannabis accessions provides a robust foundation for GWAS, aligning with established criteria for successful GWAS outcomes23.
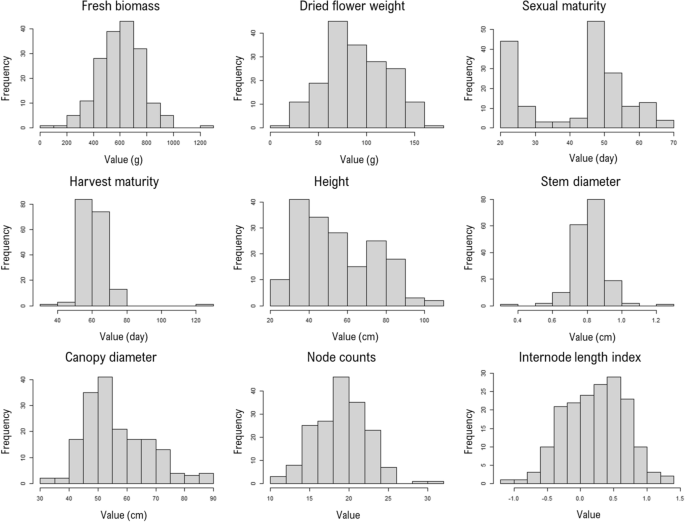
Frequency distribution of phenotypic data for 176 drug-type accessions used in this study. For each trait, the minimum and maximum values significantly differed (t-test p < 0.001) from the overall population mean.
Genetic diversity in the GWAS-panel revealed by dense genotyping
To achieve comprehensive marker coverage across the Cannabis genome, an HD-GBS approach was used. Sequencing of HD-GBS libraries generated 486 M reads, averaging 2.8 M reads per sample. This extensive sequencing effort resulted in an average per-sample coverage of 7.7% of the cs10 v2 assembly, achieving a cumulative coverage of 34.1% across the entire genome for the entire population. The analysis of variant calling from our sequencing data initially yielded a substantial dataset of 2.7 M raw variants that met the quality criteria. Following filtering for missing data and minor allele frequency (MAF of 1%), we successfully identified ~ 800 K polymorphic variants, with an overall proportion of missing data reaching 61% before imputation step. This SNP catalog meets the criteria required to perform a relevant missing data imputation56. Subsequently, we performed a secondary round of filtering, primarily aimed at retaining common variants, as defined by a MAF of 6%, retaining approximately 39% of the raw data. While this filtering step may exclude rare variants that could potentially influence complex traits, it is essential to reduce the risk of false-positive associations and ensure that a minimum of 10 accessions carries the significant allele, thereby preventing overfitting in GWAS models23. The HD-GBS approach and the filtering procedures resulted in a catalog of 282 K high-quality SNPs (all details in Supplemental Table S2). Within this catalog, 25.5% of the genotypes were found to be heterozygous and the SNPs exhibited an average MAF of 21.7%. For a detailed overview of filtering steps and the number of variants retained at each stage, refer to Supplementary Table S3. Overall, this SNP catalog represents an extensive genetic resource for the subsequent GWAS and underscores the robustness of the genotyping strategy used in this study.
Markers were exceptionally well distributed across the genome, ensuring coverage of gene-rich regions. On average, there was one marker per every ~ 3 kb of the genome, which significantly enhances the likelihood of identifying markers in strong LD with putative candidate genes or regions (Fig. 2a). Across the entire physical map, only 12 gaps exceeding 1 Mb, with the largest being 1.2 Mb, were identified. Comparing our dataset with the RAD-Seq method used in the study of Petit et al.32,33, by employing comparable filtration criteria, the HD-GBS approach yielded a comparable number of markers while utilizing only one-tenth of the sequencing efforts (averaging 2.8 M vs. 29.7 M reads per sample). Therefore, the density and genomic distribution of SNPs provided by the HD-GBS approach make it a cost-effective option for conducting GWAS on large Cannabis panel. Furthermore, this approach is compatible with the miniaturization of sequencing libraries using the NanoGBS procedure, which further contributes to substantial cost reduction in genotyping57.
The average extent of LD decay to its half ranged from 22.6 to 89.0 kb across different chromosomes (Fig. 2b). It is important to note that LD decay is a relative value and does not precisely reflect to reality recombination rates throughout the entire genome, particularly between heterochromatic and euchromatic regions58. However, this measure proved valuable for comparing the impact of domestication and selection on recombination rates among different populations. In this context, the LD observed in the GWAS-panel showed rapid decay compared to modern cultivars of comparable genome size, such as soybean (where LD may extend over 100 kb59) and tomato (where LD can extend over 1 Mb60). Nevertheless, LD decayed to its half more slowly compared to a recent study of 110 domesticated and landrace Cannabis accessions from various worldwide origins, where LD decayed over approximately 10 kb61. This resulted in a large number of small HBs with an average size of ~ 4 kb (Supplemental Table S3). It is worth noting that the LD decay on the sex chromosome was almost twice slower (p < 0.001) compared to autosomes. These observations were consistent with the recent history of Cannabis cultivation in Canada, characterized by extensive hybridization efforts by breeders with a particular focus on sexual characteristics, such as the production of female flowers2.
Low level of population structure
The population structure within the GWAS-panel was assessed using the 282 K high-quality SNPs. Initially, the degree of admixture of individuals and clustering inference was estimated by fastStructure (Supplemental Table S4). While the model maximizing the marginal likelihood suggested a K value of 6, the optimal number of principal components (PCs) to explain the structure of the population was determined to be 3. The K value of 3 revealed two clusters (clusters 1 and 3, Fig. 2c) with low admixture compared to a K value of 6 (Supplemental Fig. S1), indicating a more robust assignments with more homogeneous individuals within each cluster. Using the BIC criterion, DAPC inferred three clusters (Fig. 2d, Supplemental Fig. S2ab, Supplemental Table S4). The minimal BIC values were obtained with K values ranging from 3 to 6, consistent with the optimal number of clusters determined by fastStructure, where 3 represents the minimum value. Thus, a K of 3 was chosen to explain the structure of the GWAS panel. Comparing both methods, 94.3% and 90.0% concordant assignment were observed for K values of 3 and 6, respectively (Supplemental Fig. S4).

Genome-wide distribution of markers, linkage disequilibrium (LD) and population structure analysis. (a) Density plot of markers and genes across the genome. Colors represent the number of SNPs within 1 Mb window size. (b) LD decay in each chromosome where LD values of intra-chromosomal pairwise markers were plotted against physical distance. (c) Admixture plot for K = 3 using fastStructure. The vertical lines represent the accessions, and the y-axis represents the probability that an individual belongs to a subgroup. (d) Discriminant analysis of principal components (DAPC) scatter plot showing population structure.
Nucleotide diversity (θπ ) across the three clusters varied from 8.44 × 10⁻⁴ to 1.20 × 10⁻³. A lower level of genome-wide genetic diversity was observed here in drug-type cannabis (mean θπ = 1.05 × 10⁻³) compared to broader cannabis populations worldwide (θπ = 3.0 × 10⁻³)61. This level of diversity is also lower than that found in other major crops such as soybean (mean θπ = 1.36 × 10⁻³)62, rice (θπ = 4.0 × 10⁻³)63 and corn (θπ = 6.6 × 10⁻³)64. Relatedness analysis among individuals revealed low intra- and inter-cluster genetic diversity, with accessions appearing neither significantly similar nor significantly distant (Supplemental Fig. S3). This is consistent with the cumulative variance explaining genetic variation in the population, showing gradual increase with number of retained PCs up to 176 PCs (number of accessions in the GWAS panel) rather than reaching a plateau (Supplemental Fig. S2a). Despite the overall genetic homogeneity, significative differences were observed between clusters for traits such as SM, HM, height, NC and ILI (Supplemental Fig. S5). In particular, cluster K3 exhibited significant differences from the cluster K1 for these five traits, while the cluster K2 displayed intermediate trait values between K1 and K3. In different studies, similar clustering patterns related to drug-type and hemp-type accessions61,65,66,67 or geographic origins68 were documented, where each clusters grouped independently, albeit with low intra- and inter-cluster genetic diversity. Due to limited information on the pedigree of the GWAS panel, no correlation was observed between cluster assignment and geographic or germplasm origins. Additionally, no correlation was observed between the clustering and cannabinoid composition (data not shown) of these accessions.
The limited genetic diversity observed in cultivated drug-type Cannabis has historically been attributed to intensive clandestine breeding practices since the 1970s2, coupled with the impact of the war on drugs, which led to the destruction of many plants and seeds, effectively reducing the gene pool5,69. Despite the limited genetic diversity, Cannabis exhibits a remarkable phenotypic variation that are highly desirable for breeding programs. Hence, it could be hypothesized that a portion of the observed phenotypic variations in Cannabis may be attributed to transcriptional variations, along with potential contributions from epigenetic factors. In both plants and animals, factors such as variation in the number of gene copies (CNVs)70, epigenetic elements71, and the insertion/deletion of transposable elements (TEs) in gene control regions72, impact phenotypic diversity, especially those crucial in domestication and breeding73. Therefore, an associated SNP may be in strong LD with either a candidate gene, where an allelic variant alters the phenotype, or with a regulatory region that either enhances or suppresses the expression of the phenotype74.
The constrained availability of germplasm resources and low genetic diversity observed in Cannabis pose significant limitations for breeding, which, in turn, hinder innovation and the long-term sustainability of the crop7. In contrast to other crops where wild-type or landrace varieties are promising genetic pools to enrich genetic diversity in breeding programs75, the situation in Cannabis is more complex. Although hemp-type and drug-type Cannabis genetically diverged76, they still share a considerable common pool of genetic variation, limiting the ability to mine rare alleles65. Given the growing demand for cannabis products, there is a critical necessity to pinpoint suitable genetic resources that can not only support production but also serve as a source of genetic diversity to help ongoing breeding efforts7.
Identification of genomic regions controlling key agronomic and morphological traits
The GWAS analysis was performed using the method BLINK with the incorporation of population structure (P) and cryptic relatedness (K*) as covariates to minimize the risk of false-positive associations. In total, 18 markers associated with the nine traits were identified (Fig. 3, Table 1). For all significant markers identified, the three genotypes were observed (Supplemental Fig. S7). Six of these SNPs (SNP_1, 4, 7, 8, 9 and 11; Table 1) demonstrated significant phenotypic impact, with the proportion of phenotypic variance explained (PVE) ranging from 18 to 45% while the remaining identified markers have a modest influence on the phenotype (PVE < 10%). Interestingly, several SNPs associated with different traits were located in close proximity to each other. For instance, SNP_9and _17 were situated within a region of about 38 kb on chromosome 1 (Chr01: 87456694–87494979) and were associated with ILI and height. The identification of 2 SNPs associated with correlated traits is consistent and suggests that this region of chromosome 1 plays a crucial role in modulating plant size in the GWAS panel. These markers are associated with key characteristics for Cannabis cultivation and are therefore of particular interest to breeders and growers. For instance, markers associated with smaller size can be advantageous for maximizing indoor cultivation, where smaller plants are preferred. Regarding the markers associated with a shorter flowering or maturation, they are advantageous for cultivators aiming for a quicker crop turnover. Similarly, the allele T at Chr09:59690286 (SNP_4) is associated with reduces canopy size and slightly the height, which can help maximize plant density in cultivation.

Genome-wide association studies (GWAS) for nine agronomic and morphological traits in drug-type cannabis. Manhattan plot for productivity-related traits (a) and morphological traits (b). Each circle indicates the degree of association for a marker with a trait (y axis), while the x axis shows the physical position of each marker on a given chromosome across the genome. The horizontal grey line indicates the significance threshold (p-value = 1.77 × 10⁻⁷, false discovery rate < 0.05). Marker-trait associations were performed with the Bayesian-information and linkage-disequilibrium iteratively nested keyway (BLINK) method.
Given that the traits under study appear to be governed by a complex genetic control involving multiple QTL, BLINK appeared to be the most suitable method as it can capture intricate interactions among several loci through multi-locus analysis39. Furthermore, this method has proven its effectiveness with large catalog of SNPs77,79,79 and was ranked as the most statistically powerful method for multi-locus analyzes for GWAS in plants21,39, 80. As the identification of high-value markers for Cannabis is in its early stages, the practical implementation of these markers by breeding programs will nevertheless require preliminary cross-validation. This can be achieved through meta-GWAS81, QTL mapping with biparental population and BSA. Additionally, comprehensive functional analyses of the candidate genes will be crucial. .
Investigation of putative candidate genes
Among the 18 associated SNPs, 11 were in high LD (r2 ≥ 0.75) with other SNPs, forming HBs (Table 2). Notably, SNP_9 and _17 were part of the same HB, spanning ~ 97 kb on chromosome 1. The SNP _26 was located within LOC115699444without forming HBs. The 11 HBs spanned ~ 250 kb, within which 21 annotated genes were identified. Consequently, these genes were considered as putative candidates genes associated with different traits. Recent genome annotation of cs1048 facilitated the investigation of the functions of candidate genes (Table 2). An orthology analysis was conducted by comparing the protein sequences of candidate genes with the Arabidopsis proteome55. Functional annotations were similar for the majority of candidate genes and their respective orthologs, confirming the robustness of the functional annotation of the cs10 transcriptome.
The SNP_4, which showed associations with DFW, CD, and height, was found to be in high LD with LOC115722258, associated with chloroplast metabolism and mechanisms. This suggests a potential link between the genetic variation of SNP_4 and the observed variations in these morphological traits through their impact on chloroplast-related processesIn addition to structural genes, regulatory genes, such as transcription factors, were identified among the potential candidate genes (e.g., LOC115706624). Approximately one-third of the associated SNPs were not in high LD with putative candidate gene, but they might more likely linked to gene regulatory regions. The in-silico identification of regulatory regions and their interaction with a gene is challenging and complex to link associated SNPs and the phenotype. However, this does not diminish their importance, especially for markers SNP_7 and _8, which were associated with a substantial impact on HM (PVE > 30%). These findings suggest that regulatory elements, such as transcription factors, may play a role in shaping the phenotypic variation in cultivated Cannabis. However, confirming the relevance of these candidate genes will still require further analysis.
Conclusion
In conclusion, this study marks a pioneering exploration of the genetic landscape of Canadian drug-type Cannabis through a comprehensive GWAS analysis, enriched by high-throughput genotyping and precise agronomic phenotyping data. Our findings open new avenues for advancing Cannabis breeding programs and addressing the diverse needs of emerging industries. The application of a high-density genotyping approach yielded an extensive catalog of high-quality SNPs, effectively capturing the genomic diversity of drug-type Cannabis. The distribution of these markers across different chromosomes, coupled with high quality phenotypic data, facilitated the identification of molecular markers associated with complex agronomic and morphological traits. These markers hold great promise for further investigations to elucidate their functional links with phenotype variations, making them valuable assets for precision breeding efforts.
As we move forward, this research paves the way for in-depth studies to uncover the biological mechanisms governing these traits, potentially uncovering hidden genetic potential within Cannabis populations. Furthermore, the implications of our work extend beyond immediate applications, as the identified markers are poised to play a pivotal role in the development of tailor-made Cannabis cultivars, spanning both medicinal and recreational sectors, capable of meeting the dynamic demands of rapidly evolving industries.
Future perspectives in this domain encompass a deeper exploration of the candidate genes associated with the identified markers, seeking to unravel the intricate genetic and molecular underpinnings of these key traits. Additionally, functional validation experiments and expression profiling could elucidate the precise mechanisms through which these markers exert their effects. Collaborative efforts between academia and industry are essential to harness this newfound genetic knowledge and translate it into practical breeding strategies, ensuring the continued innovation and sustainability of the Cannabis crop.
Data availability
The VCF files generated from the sequencing data and used for the analyzes of this study are on FigShare.com and will be accessible after acceptance of the manuscript. This includes the raw SNP data set for the 176 accessions, the 282 K imputed and filtered SNPs and the subdivision of the population by K clusters.
Abbreviations
- THC:
-
Δ9-Tetrahydrocannabinol
- ICGRC:
-
International Cannabis Research Consortium
- NGS:
-
Next-generation sequencing
- GWAS:
-
Genome-Wide Association Study
- QTL:
-
Quantitative trait loci
- LD:
-
Linkage disequilibrium
- RAD-Seq:
-
Restriction-site associated DNA sequencing
- GBS:
-
Genotyping-by-sequencing
- MAS:
-
Marker-assisted selection
- GS:
-
Genomic selection
- WGS:
-
Whole-genome sequencing
- HD-GBS:
-
High-density GBS
- FB:
-
Fresh biomass
- DFW:
-
Dried flower weight
- SM:
-
Sexual maturity
- SD:
-
Stem diameter
- CD:
-
Canopy diameter
- ILI:
-
Internode Length Index
- NC:
-
Node counts
- MAF:
-
Minor allele frequency
- HB:
-
Haplotype block
- DAPC:
-
Discriminant analyses of principal components
- SUPER:
-
Settlement of MLM under progressively exclusive relationship
- BLINK:
-
Bayesian-information and linkage-disequilibrium iteratively nested keyway
- ANOVA:
-
Analyse of variance
- PERMANOVA:
-
Permutational ANOVA
- GO:
-
Gene ontology
- QQ:
-
Quantile–Quantile
- PVE:
-
Phenotypic variance explained
References
Lapierre, É., Monthony, A. S. & Torkamaneh, D. Genomics-based taxonomy to clarify cannabis classification. Genome 66, 202–211 (2023).
Clarke, R. & Merlin, M. Cannabis: Evolution and Ethnobotany. (Univ of California Press, 2016).
Hurgobin, B. et al. Recent advances in Cannabis sativa genomics research. New Phytol. 230, 73–89 (2021).
Cox, C. The Canadian Cannabis Act legalizes and regulates recreational cannabis use in 2018. Health Policy New York. 122, 205–209 (2018).
Welling, M. T. et al. A belated green revolution for Cannabis: Virtual genetic resources to fast-track cultivar development. Front. Plant Sci. 7, 205761 (2016).
Martínez, V. et al. Cannabidiol and other non-psychoactive cannabinoids for prevention and treatment of gastrointestinal disorders: useful nutraceuticals?. Int. J. Mol. Sci. 21, 3067 (2020).
Torkamaneh, D. & Jones, A. M. P. Cannabis, the multibillion dollar plant that no genebank wanted. Genome 65, 1–5 (2021).
Impact on the Canadian economy. (2023). Available at: https://ised-isde.canada.ca/site/competition-bureau-canada/en/how-we-foster-competition/education-and-outreach/planting-seeds-competition. (Accessed: 5th October 2023)
Hesami, M. et al. Recent advances in cannabis biotechnology. Ind. Crops Prod. 158, 113026 (2020).
Hanuš, L. O., Meyer, S. M., Muñoz, E., Taglialatela-Scafati, O. & Appendino, G. Phytocannabinoids: A unified critical inventory. Nat. Prod. Rep. 33, 1357–1392 (2016).
Booth, J. K. & Bohlmann, J. Terpenes in Cannabis sativa—From plant genome to humans. Plant Sci. 284, 67–72 (2019).
Kovalchuk, I. et al. The genomics of cannabis and its close relatives. Annu. Rev. Plant Biol. 71, 713–739 (2020).
Grassa, C. J. et al. A new Cannabis genome assembly associates elevated cannabidiol (CBD) with hemp introgressed into marijuana. New Phytol. 230, 1665–1679 (2021).
Laverty, K. U. et al. A physical and genetic map of Cannabis sativa identifies extensive rearrangements at the THC/CBD acid synthase loci. Genome Res. 29, 146–156 (2019).
Grassa, C. J. et al. A complete Cannabis chromosome assembly and adaptive admixture for elevated cannabidiol (CBD) content. bioRxiv. https://doi.org/10.1101/458083 (2018).
Gao, S. et al. A high-quality reference genome of wild Cannabis sativa. Hortic. Res. 7, 73. https://doi.org/10.1038/s41438-020-0295-3 (2020).
Maoz, T. Making cannabis history in 2020. (2020). Available at: https://nrgene.com/making-cannabis-history-in-2020/. (Accessed: 6th October 2023)
Morrell, P. L., Buckler, E. S. & Ross-Ibarra, J. Crop genomics: Advances and applications. Nat. Rev. Genet. 13, 85–96 (2012).
Schwabe, A. L. & McGlaughlin, M. E. Genetic tools weed out misconceptions of strain reliability in Cannabis sativa: Implications for a budding industry. J. Cannabis Res. 1, 1–16 (2019).
Metzker, M. L. Sequencing technologies the next generation. Nat. Rev. Genet. 11, 31–46 (2010).
Wang, J. & Zhang, Z. GAPIT version 3: Boosting power and accuracy for genomic association and prediction. Genom. Proteom. Bioinform. 19, 629–640 (2021).
Yin, L. et al. rMVP: A memory-efficient, visualization-enhanced, and parallel-accelerated tool for genome-wide association study. Genom. Proteom. Bioinform. 19, 619–628 (2021).
Torkamaneh, D. & Belzile, F. Genome-Wide Association Studies. 2481, (Springer US, 2022).
Bakker, E., Holloway, A., K Waterman - US Patent App. 17/665, 500 & 2023, U. Autoflowering Markers. Google Patents (2021).
Welling, M. T. et al. An extreme-phenotype genome-wide association study identifies candidate cannabinoid pathway genes in Cannabis. Sci. Rep. 10, 1–14 (2020).
Song, K., Li, L. & Zhang, G. Coverage recommendation for genotyping analysis of highly heterologous species using next-generation sequencing technology. Sci. Rep. 6, 1–7 (2016).
Scariolo, F. et al. Genotyping analysis by rad-seq reads is useful to assess the genetic identity and relationships of breeding lines in lavender species aimed at managing plant variety protection. Genes (Basel). 12, 1656 (2021).
Sonah, H. et al. An improved genotyping by sequencing (GBS) approach offering increased versatility and efficiency of SNP discovery and genotyping. PLoS One 8, 1–9 (2013).
Torkamaneh, D., Laroche, J., Boyle, B., Hyten, D. L. & Belzile, F. A bumper crop of SNPs in soybean through high-density genotyping-by-sequencing (HD-GBS). Plant Biotechnol. J. 19, 860–862 (2021).
Poland, J. A. & Rife, T. W. Genotyping‐by‐sequencing for plant breeding and genetics. Plant Genome 5. https://doi.org/10.3835/plantgenome2012.05.0005 (2012).
Sun, J. et al. Genome-wide association study of salt tolerance at the germination stage in hemp. Euphytica 219, 1–16 (2023).
Petit, J. et al. Elucidating the genetic architecture of fiber quality in hemp (Cannabis sativa L.) using a genome-wide association study. Front. Genet. 11, 566314. https://doi.org/10.3389/fgene.2020.566314 (2020).
Petit, J., Salentijn, E. M. J., Paulo, M. J., Denneboom, C. & Trindade, L. M. Genetic architecture of flowering time and sex determination in hemp (Cannabis sativa L): A genome-wide association study. Front. Plant Sci. 11, 569958 (2020).
Watts, S. et al. Cannabis labelling is associated with genetic variation in terpene synthase genes. Nat. Plants. 7, 1330–1334 (2021).
Collard, B. C. Y. & Mackill, D. J. Marker-assisted selection: An approach for precision plant breeding in the twenty-first century. Philos. Trans. R. Soc. B Biol. Sci. 363, 557–572 (2008).
Lapierre, É., de Ronne, M., Boulanger, R. & Torkamaneh, D. Comprehensive phenotypic characterization of diverse drug-type cannabis varieties from the Canadian Legal Market. Plants. 12, 3756 (2023).
Piluzza, G., Delogu, G., Cabras, A., Marceddu, S. & Bullitta, S. Differentiation between fiber and drug types of hemp (Cannabis sativa L) from a collection of wild and domesticated accessions. Genet. Resour. Crop Evol. 60, 2331–2342 (2013).
Jannink, J. L., Lorenz, A. J. & Iwata, H. Genomic selection in plant breeding: From theory to practice. Briefings Funct. Genom. Proteom. 9, 166–177 (2010).
Huang, M., Liu, X., Zhou, Y., Summers, R. M. & Zhang, Z. BLINK: A package for the next level of genome-wide association studies with both individuals and markers in the millions. Gigascience 8, 1–12 (2019).
R Core Team. R: The R Project for Statistical Computing. (2021). Available at: https://www.r-project.org/. (Accessed: 10th June 2023)
Aboul-Maaty, N.A.-F. & Oraby, H.A.-S. Extraction of high-quality genomic DNA from different plant orders applying a modified CTAB-based method. Bull. Natl. Res. Cent. 43, 1–10 (2019).
Torkamaneh, D., Laroche, J. & Belzile, F. Fast-gbs v2.0: An analysis toolkit for genotyping-by-sequencing data. Genome 63, 577–581 (2020).
Danecek, P. et al. The variant call format and VCFtools. Bioinformatics 27, 2156–2158 (2011).
Browning, B. L. & Browning, S. R. Genotype imputation with millions of reference samples. Am. J. Hum. Genet. 98, 116–126 (2016).
Danecek, P. et al. Twelve years of SAMtools and BCFtools. Gigascience 10, 1–4 (2021).
Bradbury, P. J. et al. TASSEL: Software for association mapping of complex traits in diverse samples. Bioinformatics 23, 2633–2635 (2007).
Quinlan, A. R. & Hall, I. M. BEDTools: A flexible suite of utilities for comparing genomic features. Bioinformatics 26, 841–842 (2010).
NCBI Cannabis sativa Annotation Release 100. (2019). Available at: https://www.ncbi.nlm.nih.gov/genome/annotation_euk/Cannabis_sativa/100/. (Accessed: 11th October 2023)
Nei, M. & Li, W. H. Mathematical model for studying genetic variation in terms of restriction endonucleases. Proc. Natl. Acad. Sci. 76, 5269–5273 (1979).
Purcell, S. et al. PLINK: A tool set for whole-genome association and population-based linkage analyses. Am. J. Hum. Genet. 81, 559–575 (2007).
Remington, D. L. et al. Structure of linkage disequilibrium and phenotypic associations in the maize genome. Proc. Natl. Acad. Sci. USA. 98, 11479–11484 (2001).
Raj, A., Stephens, M. & Pritchard, J. K. FastSTRUCTURE: Variational inference of population structure in large SNP data sets. Genetics 197, 573–589 (2014).
Jombart, T., Devillard, S. & Balloux, F. Discriminant analysis of principal components: A new method for the analysis of genetically structured populations. BMC Genet. 11, 1–15 (2010).
Emms, D. M. & Kelly, S. OrthoFinder: Phylogenetic orthology inference for comparative genomics. Genome Biol. 20, 1–14 (2019).
Cheng, C. Y. et al. Araport11: A complete reannotation of the Arabidopsis thaliana reference genome. Plant J. 89, 789–804 (2017).
Torkamaneh, D. & Belzile, F. Scanning and filling: Ultra-dense SNP genotyping combining genotyping-by-sequencing, SNP array and whole-genome resequencing data. PLoS One 10, e0131533 (2015).
Torkamaneh, D. et al. NanoGBS: A miniaturized procedure for GBS library preparation. Front. Genet. 11, 1–8 (2020).
Zhang, J. et al. Genome-wide association study for flowering time, maturity dates and plant height in early maturing soybean (Glycine max) germplasm. BMC Genom. 16, 1–11 (2015).
Viana, J. P. G. et al. Impact of multiple selective breeding programs on genetic diversity in soybean germplasm. Theor. Appl. Genet. 135, 1591–1602 (2022).
Liu, X., Geng, X., Zhang, H., Shen, H. & Yang, W. Association and genetic identification of loci for four fruit traits in tomato using InDel markers. Front. Plant Sci. 8, 275267 (2017).
Ren, G. et al. Large-scale whole-genome resequencing unravels the domestication history of Cannabis sativa. Sci. Adv. 7, 2286–2302 (2021).
Torkamaneh, D. et al. Soybean (Glycine max) Haplotype Map (GmHapMap): A universal resource for soybean translational and functional genomics. Plant Biotechnol. J. 19, 324–334 (2021).
Wang, W. et al. Genomic variation in 3010 diverse accessions of Asian cultivated rice. Nature. 557, 43–49 (2018).
Chia, J. M. et al. Maize HapMap2 identifies extant variation from a genome in flux. Nat. Genet. 44, 803–807 (2012).
Sawler, J. et al. The genetic structure of marijuana and hemp. PLoS One 10, e0133292 (2015).
Lynch, R. C. et al. Genomic and chemical diversity in Cannabis. CRC. Crit. Rev. Plant Sci. 35, 349–363 (2016).
Soorni, A., Fatahi, R., Haak, D. C., Salami, S. A. & Bombarely, A. Assessment of genetic diversity and population structure in Iranian Cannabis Germplasm. Sci. Rep. 7, 1–10 (2017).
Zhang, J. et al. Genetic diversity and population structure of cannabis based on the genome-wide development of simple sequence repeat markers. Front. Genet. 11, 543438 (2020).
Clarke, R. C. & Merlin, M. D. Cannabis domestication, breeding history, present-day genetic diversity, and future prospects. CRC. Crit. Rev. Plant Sci. 35, 293–327 (2016).
Lye, Z. N. & Purugganan, M. D. Copy number variation in domestication. Trends Plant Sci. 24, 352–365 (2019).
Springer, N. M. Epigenetics and crop improvement. Trends Genet. 29, 241–247 (2013).
Gill, R. A. et al. On the role of transposable elements in the regulation of gene expression and subgenomic interactions in crop genomes. CRC. Crit. Rev. Plant Sci. 40, 157–189 (2021).
Alonge, M. et al. Major impacts of widespread structural variation on gene expression and crop improvement in tomato. (2020). https://doi.org/10.1016/j.cell.2020.05.021
Liseron-Monfils, C. & Ware, D. Revealing gene regulation and associations through biological networks. Curr. Plant Biol. 3–4, 30–39 (2015).
Smýkal, P., Nelson, M. N., Berger, J. D. & Von Wettberg, E. J. B. The impact of genetic changes during crop domestication. Agronomy. 8, 119 (2018).
Schwabe, A. L., Hansen, C. J., Hyslop, R. M. & McGlaughlin, M. E. Comparative genetic structure of cannabis sativa including federally produced, wild collected, and cultivated samples. Front. Plant Sci. 12, 675770 (2021).
de Ronne, M. et al. Mapping of partial resistance to Phytophthora sojae in soybean PIs using whole-genome sequencing reveals a major QTL. Plant Genome 15, e20184 (2022).
Zhong, H. et al. Uncovering the genetic mechanisms regulating panicle architecture in rice with GPWAS and GWAS. BMC Genom. 22, 1–13 (2021).
Cui, Z. et al. Denser markers and advanced statistical method identified more genetic loci associated with husk traits in maize. Sci. Rep. 10, (2020).
Kaler, A. S., Gillman, J. D., Beissinger, T. & Purcell, L. C. Comparing different statistical models and multiple testing corrections for association mapping in soybean and maize. Front. Plant Sci. 10, 1794. https://doi.org/10.3389/fpls.2019.01794 (2020).
Izquierdo, P., Kelly, J. D., Beebe, S. E. & Cichy, K. Combination of meta-analysis of QTL and GWAS to uncover the genetic architecture of seed yield and seed yield components in common bean. Plant Genome 16, e20328 (2023).
Acknowledgements
The authors wish to thank Fuga Group Inc. for supporting this project. The authors also extend their sincere appreciation to Justine Richard-Giroux, Rosemarie Boulanger and Sean Kyne for their valuable contributions to the tedious phenotyping of the GWAS-panel.
Funding
This work was conducted as part of a collaborative research project funded by Fuga Group Inc. and NSERC Alliance [#ALLRP 568653-21 to D.T.].
Author information
Authors and Affiliations
Contributions
Maxime de Ronne: Conceptualization and Methodology; Data curation and analysis; Investigation; Visualization; Writing-original draft. Éliana Lapierre: Preparation of phenotypic data. Davoud Torkamaneh: Funding acquisition; Conceptualization and Methodology; Supervision; Writing-review. All authors have reviewed and approved the manuscript.
Corresponding author
Ethics declarations
Competing interests
The authors declare no competing interests.
Additional information
Publisher's note
Springer Nature remains neutral with regard to jurisdictional claims in published maps and institutional affiliations.
Supplementary Information
Rights and permissions
Open Access This article is licensed under a Creative Commons Attribution 4.0 International License, which permits use, sharing, adaptation, distribution and reproduction in any medium or format, as long as you give appropriate credit to the original author(s) and the source, provide a link to the Creative Commons licence, and indicate if changes were made. The images or other third party material in this article are included in the article's Creative Commons licence, unless indicated otherwise in a credit line to the material. If material is not included in the article's Creative Commons licence and your intended use is not permitted by statutory regulation or exceeds the permitted use, you will need to obtain permission directly from the copyright holder. To view a copy of this licence, visit http://creativecommons.org/licenses/by/4.0/.
About this article

Cite this article
de Ronne, M., Lapierre, É. & Torkamaneh, D. Genetic insights into agronomic and morphological traits of drug-type cannabis revealed by genome-wide association studies. Sci Rep 14, 9162 (2024). https://doi.org/10.1038/s41598-024-58931-w
Received:
Accepted:
Published:
DOI: https://doi.org/10.1038/s41598-024-58931-w
Keywords
Comments
By submitting a comment you agree to abide by our Terms and Community Guidelines. If you find something abusive or that does not comply with our terms or guidelines please flag it as inappropriate.
