
Abstract
Cardiovascular disease (CVD) can be determined and quantified using the electrocardiogram (ECG) analysis. Identification of the risk factors associated with ECG abnormalities may advise prevention approaches to decrease CVD burden. In this study we aimed to investigate the association between CVD risk factors and minor and major ECG abnormalities in a general Iranian adult population. This study was conducted in 2010 and covered a population of 9035 males and females aged 35 to 65 years recruiting from the phase I of Mashhad Stroke and Heart Atherosclerotic Disorder (MASHAD) cohort study. The participants were drawn by a stratified cluster random sampling technique. The Bivariate and multinomial logistic regression analysis were conducted considering gender stratification to explore the association of ECG abnormalities with traditional cardiovascular risk factors. There was a significant association between minor and major ECG abnormalities and hypertension (HTN), type 2 diabetes (T2DM), smoking, and physical activity (p < 0.005). There was a significant trend, in both genders, for increasing major abnormalities as the number of CVD risk factors increased. But, only in women, the minor abnormalities increase in frequency as the number of CVD risk factors increased. The results of multinomial logistic regression showed that men with HTN [ARRR = 1.25, 95% CI 0.99, 1.57] and T2DM [ARRR = 1.31, 95% CI 0.99, 1.74] had the highest likelihood to have major abnormalities, although these are not statistically significant. For women, those with HTN had the highest likelihood to have major [ARRR = 1.36, 95% CI 1.13, 1.63] and minor [ARRR = 1.35, 95% CI 1.15, 1.58] abnormalities. Also, women aged > 60 years were more likely to have major [ARRR = 2.01, 95% CI 1.49, 2.74] and minor [ARRR = 1.59, 95% CI 1.20, 2.10] abnormalities compared to women aged < 45 years. Age and HTN were significantly associated with major and minor ECG abnormalities in women, and, on the other hand, HTN and T2DM were associated with major abnormalities in men. Taken together, these findings suggest that healthcare providers should advise preventive approaches to the asymptomatic adults with both major and minor electrocardiographic abnormalities that may predict cardiovascular risk.
Introduction
Cardiovascular diseases (CVDs) represent the most widespread non-communicable diseases and hold the position of being the primary cause of mortality on a global scale1. According to a report by the World Health Organization, CVDs accounted for 32% of all recorded deaths2. The organization also reported an increasing trend in the mortality rate of CVDs, with an expected rise from 16.7 million deaths in 2010 to a forecasted 23.3 million deaths by the year 20303. It is believed that over half of cardiovascular death can be attributed to the presence of following prominent risk factors: aging, hypercholesterolemia, hypertension (HTN), type 2 diabetes (T2DM), obesity, and smoking4. The prevalence of many risk factors of CVDs is increasing, particularly in developing regions5.
Despite the continuous progression of new technologies for the diagnostic evaluation of patients with CVD, the electrocardiogram (ECG) remains an essential tool6. Several studies have demonstrated promising prospects of utilizing the Minnesota ECG Code Classification System for the diagnosis of clinical types of coronary artery disease and heart failure, in addition to prognosticating CVD mortality7,8,9.
The ECG is a good candidate to use for risk stratification of apparently healthy participants due to its safety, wide availability, and low cost. Whereas routine ECG performance among healthy adults is not supported by present evidence10. If current CVD risk assessment tools could be enhanced, treatment might be improved, thereby maximizing the advantages of and minimizing the disadvantages of screening11.
Some studies reported the association of traditional CVD risk factors with ECG abnormalities12,13. However, it is not clear whether and to what extent these factors are associated with abnormal ECG changes in Iranian population. Identifying the groups at increased risk for ECG abnormalities may advise prevention approaches focused on modifiable risk factors to decrease the ECG abnormalities burden, which may in turn develop CVD prevention. This study was designed to explore the association of traditional CVD risk factors and major and minor ECG abnormalities on a large community in Iran.
Methods
Study population
This cross‐sectional study was carried out on the population of the first phase of Mashhad stroke and heart atherosclerotic disorder (MASHAD) cohort study. The MASHAD cohort study was initiated in 2010, consisting of 9704 participants aged 35 to 65 years. The population study were drawn from three regions in Mashhad by a stratified cluster random sampling technique. Details of the study design and sampling methods have been published previously14. Among the 9704 subjects, the ECGs of 9035 subjects were available for final analysis including 3615 (40.0%) males and 5420 (60.0%) females.
Anthropometric assessments
Height, weight, and body mass index (BMI) were assessed regarding the standardized protocols15 in all subjects. Height (cm) was recorded to the nearest millimetre using a tape measure. Weight (kg) was measured to the nearest 0.1 kg using electronic scales. The BMI was evaluated by dividing weight (kg) to height squared (m2)15. Obesity was considered when BMI ≥ 30 kg/m216.
Laboratory evaluation
Blood samples of all subjects were gathered after a 14 h overnight fasting. Serum total cholesterol (TC) and fasting blood glucose (FBG) were estimated using enzymatic methods on an automated analyser. Hypercholesterolemia was defined as TC ≥ 240 mg/dl17. T2DM was described as FBG ≥ 126 mg/dl or previously diagnosed Type 2 T2DM18.
Blood pressure assessment
Systolic blood pressure (SBP) and diastolic blood pressure (DBP) were measured by standard mercury sphygmomanometers. HTN was defined as a SBP ≥ 140 mmHg or a DBP ≥ 90 mmHg or a history of HTN19.
Assessment of physical activity
The questionnaire utilized for evaluating physical activity was regarding the James and Schofield human energy requirements equations and was filled out by each participant. Questions were classified into three sections including the activities in work hours, off time, and in bed20. Individuals with 1–1.39 physical activity level were classified in inactive group and those who had PAL more than 1.4 were categorized as active ones21.
Assessment of other variables
Demographic and socioeconomic features (e.g. age, gender, education, and occupation status) and smoking (current smoker, ever smoker and never smoker) for all subjects were recorded by health care professionals and a nurse interview.
Electrocardiographic measures
A standard resting 12-lead ECG at a 25 mm/s paper speed and at 10 mm/mV was digitally recorded. All ECGs were inspected visually to detect technical errors, missing leads, and inadequate quality, and such records were rejected from electrocardiographic data files.
The readable ECGs (n = 9035) were subsequently examined and recorded by trained senior medical students regarding the Minnesota coding (MC) system22,23. ECG abnormalities were divided as major and minor abnormalities based on the standards of the MC for ECG classification22. Major ECG abnormalities were defined as any of the following: major Q wave abnormalities (MC 1-2, 1-2), Minor Q wave abnormalities Plus ST-T abnormalities (MC 4-1 or 4-2, or 5-1 or 5-2), Major isolated ST-T abnormalities (MC 4-1 or 4-2 or 5-1 or 5-2), complete or intermittent left bundle branch block (LBBB) (MC 7-1), right bundle branch block (RBBB) (MC 7-2), nonspecific intraventricular block (MC 7-4), RBBB with left anterior hemiblock (MC 7-8), Brugada pattern (MC 7-9), left ventricular hypertrophy plus ST-T abnormalities (MC 3-1 plus MC 4-1 or 4-2), Major QT index ≥ 116%, where QT Index = [QT interval × (heart rate + 100)/656]24, atrial fibrillation or flutter (MC 8-3), Third-degree AV conduction (AVB3) (MC 6-1), second-degree AV block (AVB2) (MC 6-2), WPW (MC 6-4), artificial pacemaker (MC 6-8), ventricular fibrillation or ventricular asystole (MC 8-2), supraventricular tachycardia (SVT) (MC 8-4-2 or MC 8-4-1 with Heart rate > 140). Minor abnormalities included: minor isolated Q/QS waves (MC 1-3), minor ST/T abnormalities (MC 4-3, 4-4, 5-3, 5-4), high R wave (left ventricular) (MC 3-1, 3-3, 3-4), high R wave (right ventricular) (MC 3-2), ST segment elevation (MC 9-2), incomplete RBBB (MC 7-3), incomplete LBBB (MC 7-6, 7-7), minor QT prolongation (QT index ≥ 112%), short PR interval (MC 6-5), long PR interval (MC 6-3), left axis deviation (MC 2-1), right axis deviation (MC 2-2), premature supraventricular beats (MC 8-1-1),premature ventricular beats (MC 8-1-2), premature combined beats (MC 8-1-3, 8-1-5), wandering atrial pacemaker (MC 8-1-4), sinus tachycardia (MC 8-7), sinus bradycardia (MC 8-8), supraventricular rhythm persistent (MC 8-4-1), low voltage QRS (MC 9-1), high amplitude P wave (MC 9-3), left atrial enlargement (LAE) (MC 9-6-), fragmented QRS (MC 7-1-0). Participants with both major and minor abnormalities were classified as having major abnormalities. Participants without minor or major ECG abnormalities were classified as having marginal or no abnormalities and their ECG was considered normal10.
Statistical analysis
In this study, both descriptive, bivariate and multinomial logistic regression analysis were conducted considering gender stratification. The quantitative results were stated as mean and standard deviation and the qualitative results as frequency and percentage. Independent t-test and chi-square tests were used to compare the variables by sex. Bonferroni adjustments was used for multiple testing. Additionally, Multinomial logistic regression model was employed because the dependent variable had three outcomes (normal, minor and major). The results for the multinomial logistic regression analyses were presented as relative risk ratios (RRR) with their respective 95% confidence intervals (CIs) signifying precision. Also, to eliminate the effect of confounders, adjusted relative risk ratios (ARRR) along with their respective 95% confidence intervals (CIs) were used. All the analyses were done with SPSS version 26.
Ethical approval and consent of participant
The Human Research Ethics Committee of Mashhad University of Medical Sciences (MUMS) reviewed and approved the study (IR.MUMS.MEDICAL.REC.1399.783). All subjects provided written informed consent. For illiterate participants, their literate spouse or children read and sign the form. All study procedures were conducted according to the World Medical Association Declaration of Helsinki ethical standards for medical research25.
Results
Baseline characteristics of the participants by gender is showed in Table 1. Average (± SD) of the age was 48.91 ± 8.40 years in men and 47.60 ± 8.09 years in women, respectively.
The relationship between abnormal ECG changes and cardiovascular risk factors is presented in Table 2. There was a considerable association between minor and major abnormalities and HTN, T2DM, smoking, and physical activity.
The comparison of the major and minor ECG abnormalities by CVD risk status or disease in men and women is shown in Tables 3 and 4. There was a significant trend, in both men and women, for increasing major abnormalities as the number of CVD risk factors increased. But, only for women, minor abnormalities increased as the number of CVD risk factors increased. The results showed that men with more than 3 CVD risk factors were more likely [RRR = 1.39, 95% CI 1.01, 1.93] to have major abnormalities compared to those with no CVD risk factor. Also, women with 1 and 2 risk factor and more than 3 CVD risk factors were more likely [RRR = 1.21, 95% CI 1.01, 1.45] and [RRR = 1.41, 95% CI 1.10, 1.81] to have major abnormalities compared to those with no CVD risk factor, respectively. Minor abnormalities increased about 50 percent [RRR = 1.50, 95% CI 1.21, 1.85] for women with more than 3 CVD risk factors compared to those with no CVD risk factor.
Tables 5 and 6 present the results on the multinomial logistic regression analysis on ECG abnormalities among men and women.
With no abnormalities (normal) as the base outcome, the results showed that men with HTN had the highest likelihood [by 25%] to have major abnormalities, although it is not statistically significant. Also, those with T2DM had the highest likelihood [by 31%] to have major abnormalities, although it is not statistically significant.
Women aged 45–60 and > 60 years were more likely [by 34%] and [About 2 times] to have higher risk of major abnormalities compared to those aged < 45, respectively.
Also, those with HTN had the highest likelihood [by 36%] to have major abnormalities.
Women aged 45–60 and > 60 years were more likely [by 24%] and [by 59%] to have higher risk of minor abnormalities compared to those aged < 45, respectively. Women illiterate and primary education were more likely [by 45%] and [by 52%] to have minor abnormalities compared to those with diploma an above, respectively. Also, those with HTN had the highest likelihood [by 35%] to have minor abnormalities.
The main findings of the Tables 5 and 6 are shown in Fig. 1. Figure 1 showed the adjusted relative risk ratios and confidence intervals for minor and major ECG abnormalities in male and female.
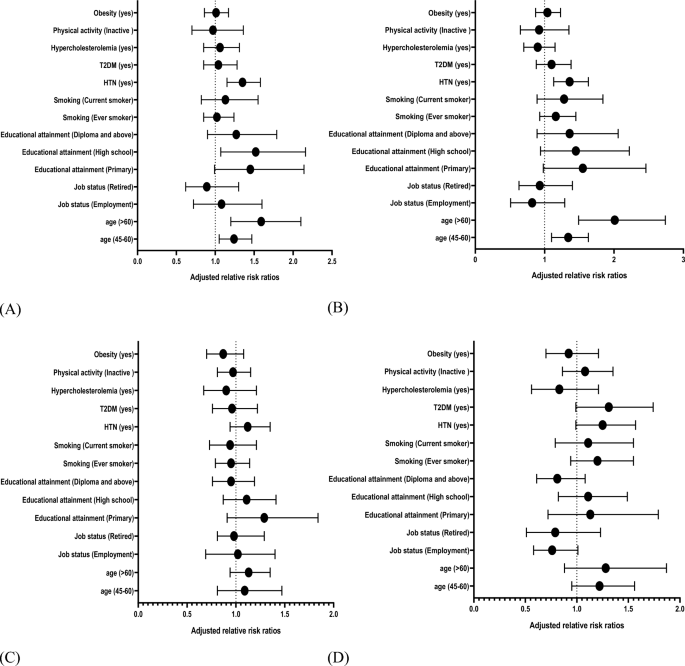
Adjusted relative risk ratios and confidence intervals of predictor variables for ECG abnormalities by gender. (A) Minor ECG abnormalities in female. (B) Major ECG abnormalities in female. (C) Minor ECG abnormalities in male. (D) Major ECG abnormalities in male.
Discussion
Our results showed that in a population-based study of men and women, minor and major ECG abnormalities were associated with age, history of HTN, and T2DM. An interesting finding of our study was that the major ECG abnormalities increased as the number of CVD risk factors increased in both men and women. But, only for women, minor abnormalities increased as the number of CVD risk factors increased.
After multinomial logistic regression analysis, only age and HTN remained significantly associated with major and minor ECG abnormalities in females. In males, age, HTN and T2DM were associated with major abnormalities. Although these associations were not statistically significant, they are clinically important.
The risk of CVD differs between men and women due to a protective impact of sex steroid hormones in women, particularly estrogen26. Therefore, we did all analysis in both genders separately.
This study showed that minor and major ECG abnormalities increased with aging in women. In line with our research, In both genders, the odds of presenting major ECG abnormalities surge with a rise in age27,28. The etiology of the observed ECG variations between age groups are not completely identified. These ECG differences between age groups may be contributed to developmental, electrical, and structural conduction system alternations in the heart throughout life29. Moreover, differences in the atherosclerosis and other CVDs risks, comorbidities, medications, and lifestyle parameters can also affect ECG components at different ages28,30.
HTN is one of the main risk factors for CVD. In our investigation, it was shown that HTN has a remarkable association with both minor and major ECG abnormalities in women. A similar study indicated that the ECG abnormalities were more commonly observed in the hypertensive group rather than the normotensive group31. In addition, a review study reported a significant association between HTN and ECG abnormalities including QTc prolongation and QRS wave fragmentation32. Our finding supports that evidence declaring that hypertensive condition can results in cardiac structure and electrical abnormalities33.
T2DM is another risk factor of CVD that is associated with major ECG abnormalities in men. In consistent with our results, Sahil et al. investigated the prevalence of ECG abnormalities in asymptomatic diabetic patients. Twenty-six percent of diabetic patients had ECG abnormalities whereas in the control group, no ECG abnormalities were reported34. In another research, minor and major ECG abnormalities were common in all diabetics (29.1%), including patients with no CVD history (24%)35. A small study in Sub-Sahara Africa mentioned conduction defects (11.9%) and arrhythmias (16.2%) as the two most common ECG abnormalities among diabetic patients36. The high prevalence of these two abnormalities might be attributed to missed ischemic heart daises and/or contractile disorders as consequence of disturbed Ca2+ handing triggered by T2DM, a suggested mechanism of diabetic cardiomyopathy37.
Physical activity levels were associated with minor and major abnormalities in this study. Commonly, physical activity is advised for the prevention of CVD. However, some electrical and structural changes occur in the heart of athletes secondary to intense exercise including sinus bradycardia, early repolarization, prolongation of QT interval, and first-degree atrioventricular block38,39. In our study, smoking was not significantly associated with major and minor ECG abnormalities. A study by Michelle et al. showed that ECG abnormalities are more common in cigarette smokers compared to the healthy individuals40. In another investigation, the ECG of 532 smokers recorded in the baseline and after 3 years. Major ECG abnormalities significantly were related to higher pack-years. Almost 43 percent of participants quit smoking after three years41. The reason for this discrepancy is not clear but it may be due to the number of pack-years in participants and the duration of being smoker. Further studies, which take these variables into account, will need to be undertaken.
We didn’t find any association between minor and major ECG abnormalities with obesity and hypercholesterolemia. In line with our study, two other studies also denied any association between left ventricular hypertrophy patterns in ECG and obesity42,43. However, it is previously identified that obese cases may have ECG changes including, low QRS voltage, left ventricular hypertrophy, and leftward shifts of the P wave QRS and T wave axes44. An analysis of 302 women aged 50 to 69 years showed that abdominal obesity and hyperlipidemia had no association with ventricular repolarization45.
In spite of our findings, obesity was reported to be associated with the prolongation of PR interval and the widening of QRS46. This disparity may be due to the heterogeneity of our data or confounding variables. In addition, there are different types of obesity phenotypes including metabolic healthy and metabolic unhealthy obesity which didn’t separate in this research. Researchers showed that poor metabolic health is more important than BMI and fat mass for the development of CVD47. According to current evidence, the metabolic unhealthy obesity phenotype is more predisposed to cardiovascular events48. Thus, we suggest future studies to investigate the association of ECG abnormalities with obesity phenotypes.
In another part of this research, the association between specific minor and major ECG abnormalities and the number of CVD risk factors was also analyzed separately. We observed that in men, as the number of CVD risk factors increases, the frequency of the presence of minor isolated Q/QS waves, high R waves (left ventricular), and major abnormalities increase as well. In women, the frequency of minor abnormalities, minor isolated Q/QS waves, minor isolated Q/QS waves, long PR interval, sinus tachycardia, left atrial enlargement, major abnormalities, complete or intermittent RBBB, and nonspecific intraventricular block were associated with the higher number of CVD risk factors. A similar study among 16 415 Hispanic/Latinos reported there was a significant trend for increasing prevalence of minor isolated ST-T abnormalities, left ventricular hypertrophy plus major ST-T abnormality, major Q waves, major isolated ST-T abnormalities, and ventricular conduction defects with the number of CVD risk factors and prevalent CVD in men. In women, minor isolated ST-T abnormalities, minor isolated Q waves, tall R waves, major Q waves, major isolated ST-T abnormalities, left ventricular hypertrophy plus major ST-T abnormality, and major QT prolongation index with the number of CVD risk factors and prevalent CVD49.
The key strength of the study is that an in-depth analysis was undertaken to investigate the relationship between CVD risk factors and ECG abnormalities in a large sample size. However, a number of limitations need to be noted regarding the present study. It is a cross-sectional study, so the causal relationship cannot be determined. Also, the individuals over 65 years and/or lower than 35 years were not included in this study. Another limitation is the fact that only one ECG was obtained at the beginning of the study, ECG criteria can be dynamic and could be more useful if multiple ECGs were obtained at various time points.
Conclusion
This study showed that age and HTN significantly associated with major and minor ECG abnormalities in women, and HTN and DM were associated with major abnormalities in men. Therefore, pursuing therapeutic lifestyle modification to decrease blood pressure and blood glucose are realistic and testable approaches to lower the risk of some prognostically important ECG abnormalities.
Data availability
The authors confirm that the data supporting the findings of this study are available from the corresponding author on request.
References
Banatvala, N. & Bovet, P. Noncommunicable diseases: A compendium (Taylor & Francis, 2023).
(WHO). W. H. O. Cardiovascular diseases (CVDs) (2021).
Soltani, S. et al. Community-based cardiovascular disease prevention programmes and cardiovascular risk factors: A systematic review and meta-analysis. Public Health 200, 59–70. https://doi.org/10.1016/j.puhe.2021.09.006 (2021).
Patel, S. A., Winkel, M., Ali, M. K., Narayan, K. M. & Mehta, N. K. Cardiovascular mortality associated with 5 leading risk factors: National and state preventable fractions estimated from survey data. Ann. Intern. Med. 163, 245–253. https://doi.org/10.7326/m14-1753 (2015).
Krittayaphong, R. et al. Electrocardiographic predictors of cardiovascular events in patients at high cardiovascular risk: A multicenter study. J. Geriatr. Cardiol. JGC 16, 630–638. https://doi.org/10.11909/j.issn.1671-5411.2019.08.004 (2019).
Rafie, N., Kashou, A. H. & Noseworthy, P. A. ECG interpretation: Clinical relevance, challenges, and advances. Hearts 2, 505–513 (2021).
Soliman, E. Z. et al. Usefulness of maintaining a normal electrocardiogram over time for predicting cardiovascular health. Am. J. Cardiol. 119, 249–255 (2017).
Denes, P., Larson, J. C., Lloyd-Jones, D. M., Prineas, R. J. & Greenland, P. Major and minor ECG abnormalities in asymptomatic women and risk of cardiovascular events and mortality. Jama 297, 978–985 (2007).
Tamosiunas, A. et al. Trends in electrocardiographic abnormalities and risk of cardiovascular mortality in Lithuania, 1986–2015. BMC Cardiovasc. Disord. 19, 1–9 (2019).
Auer, R. et al. Association of major and minor ECG abnormalities with coronary heart disease events. Jama 307, 1497–1505 (2012).
Curry, S. J. et al. Risk assessment for cardiovascular disease with nontraditional risk factors: US preventive services task force recommendation statement. Jama 320, 272–280 (2018).
Healy, C. F. & Lloyd-Jones, D. M. Association of traditional cardiovascular risk factors with development of major and minor electrocardiographic abnormalities: A systematic review. Cardiol. Rev. 24, 163–169. https://doi.org/10.1097/crd.0000000000000109 (2016).
Niu, J. et al. The association and predictive ability of ECG abnormalities with cardiovascular diseases: A prospective analysis. Glob. Heart 15, 59. https://doi.org/10.5334/gh.790 (2020).
Ghayour-Mobarhan, M. et al. Mashhad stroke and heart atherosclerotic disorder (MASHAD) study: Design, baseline characteristics and 10-year cardiovascular risk estimation. Int. J. Public Health 60, 561–572 (2015).
Norton, K. Measurement techniques in anthropometry. Antropometrica (1996).
Purnell, J. Q. Definitions, classification, and epidemiology of obesity. Endotext (2023).
Shrestha, B., Shrestha, S. & Dhital, B. M. Lipid abnormalities in patients suffering from migraine. J. Chitwan Med. Coll. 13, 49–52 (2023).
World Health Organization. Noncommunicable diseases global monitoring framework: Indicator definitions and specifications (2014).
Giles, T. D., Materson, B. J., Cohn, J. N. & Kostis, J. B. Definition and classification of hypertension: An update. J. Clin. Hypertens. 11, 611–614 (2009).
Gerrior, S., Juan, W. & Peter, B. An easy approach to calculating estimated energy requirements. Prev. Chronic Dis. 3, A129 (2006).
James, W. P. T. & Schofield, E. C. Human energy requirements. A manual for planners and nutritionists (Oxford University Press, 1990).
Prineas, R. J., Crow, R. S. & Zhang, Z.-M. The Minnesota code manual of electrocardiographic findings (Springer, 2009).
Saffar Soflaei, S. et al. A large population-based study on the prevalence of electrocardiographic abnormalities: A result of Mashhad stroke and heart atherosclerotic disorder cohort study. Ann. Noninvasive Electrocardiol. 28, e13086 (2023).
Rautaharju, P. M., Warren, J. W. & Calhoun, H. P. Estimation of QT prolongation: A persistent, avoidable error in computer electrocardiography. J. Electrocardiol. 23, 111–117 (1990).
World Medical Association. World Medical Association Declaration of Helsinki: Ethical principles for medical research involving human subjects. JAMA 310, 2191–2194 (2013).
Peters, S. A., Muntner, P. & Woodward, M. Sex differences in the prevalence of, and trends in, cardiovascular risk factors, treatment, and control in the United States, 2001 to 2016. Circulation 139, 1025–1035 (2019).
Khane, R. S., Surdi, A. D. & Bhatkar, R. S. Changes in ECG pattern with advancing age. J. Basic Clin. Physiol. Pharmacol. 22, 97–101. https://doi.org/10.1515/JBCPP.2011.017 (2011).
Ahmadi, P. et al. Age and gender differences of basic electrocardiographic values and abnormalities in the general adult population; Tehran Cohort Study. BMC Cardiovasc. Disord. 23, 1–13 (2023).
Olgar, Y. et al. Aging related functional and structural changes in the heart and aorta: MitoTEMPO improves aged-cardiovascular performance. Exp. Gerontol. 110, 172–181. https://doi.org/10.1016/j.exger.2018.06.012 (2018).
North, B. J. & Sinclair, D. A. The intersection between aging and cardiovascular disease. Circ. Res. 110, 1097–1108. https://doi.org/10.1161/circresaha.111.246876 (2012).
Lehtonen, A. O. et al. Prevalence and prognosis of ECG abnormalities in normotensive and hypertensive individuals. J. Hypertens. 34, 959–966. https://doi.org/10.1097/hjh.0000000000000882 (2016).
Bird, K. et al. Assessment of hypertension using clinical electrocardiogram features: A first-ever review. Front. Med. 7, 583331 (2020).
Conceição-Vertamatti, A. G. et al. Electrocardiographic abnormalities in hypertension models. Int. J. Cardiovasc. Sci. 33, 321–328 (2020).
Gupta, S., Gupta, R. K., KulShReStha, M. & ChaudhaRy, R. R. Evaluation of ECG abnormalities in patients with asymptomatic type 2 diabetes mellitus. J. Clin. Diagn. Res. JCDR 11, OC39 (2017).
Harms, P. P. et al. Prevalence of ECG abnormalities in people with type 2 diabetes: The Hoorn diabetes care system cohort. J. Diabetes Complicat. 35, 107810 (2021).
DZuDiE, A. et al. Prevalence and determinants of electrocardiographic abnormalities in sub-Saharan African individuals with type 2 diabetes: Cardiovascular topic. Cardiovasc. J. Afr. 23, 533–537 (2012).
Bugger, H. & Abel, E. D. Molecular mechanisms of diabetic cardiomyopathy. Diabetologia 57, 660–671 (2014).
Mirahmadizadeh, A. et al. The relationship between demographic features, anthropometric parameters, sleep duration, and physical activity with ECG parameters in Fasa Persian cohort study. BMC Cardiovasc. Disord. 21, 1–11 (2021).
Abela, M. & Sharma, S. Abnormal ECG findings in athletes: clinical evaluation and considerations. Curr. Treat. Options Cardiovasc. Med. 21, 1–17 (2019).
Ip, M. et al. Tobacco and electronic cigarettes adversely impact ECG indexes of ventricular repolarization: Implication for sudden death risk. Am. J. Physiol. Heart Circ. Physiol. 318, H1176–H1184 (2020).
Gepner, A. D. et al. Electrocardiographic changes associated with smoking and smoking cessation: Outcomes from a randomized controlled trial. PLoS One 8, e62311. https://doi.org/10.1371/journal.pone.0062311 (2013).
Lin, Y.-K. et al. Obesity phenotypes and electrocardiographic characteristics in physically active males: CHIEF study. Front. Cardiovasc. Med. 8, 738575 (2021).
Muiesan, M. L. et al. Obesity and ECG left ventricular hypertrophy. J. Hypertens. 35, 162–169 (2017).
Fraley, M., Birchem, J., Senkottaiyan, N. & Alpert, M. Obesity and the electrocardiogram. Obes. Rev. 6, 275–281 (2005).
Pshenichnikov, I. et al. Association between ventricular repolarization and main cardiovascular risk factors. Scand. Cardiovasc. J. SCJ 45, 33–40. https://doi.org/10.3109/14017431.2010.532232 (2011).
Sun, G. Z. et al. Association between obesity and ECG variables in children and adolescents: A cross-sectional study. Exp. Ther. Med. 6, 1455–1462 (2013).
Dobson, R. et al. Metabolically healthy and unhealthy obesity: Differential effects on myocardial function according to metabolic syndrome, rather than obesity. Int. J. Obes. 40, 153–161. https://doi.org/10.1038/ijo.2015.151 (2016).
Eckel, N. et al. Transition from metabolic healthy to unhealthy phenotypes and association with cardiovascular disease risk across BMI categories in 90 257 women (the Nurses’ Health Study): 30 year follow-up from a prospective cohort study. Lancet Diabetes Endocrinol. 6, 714–724 (2018).
Denes, P. et al. Major and minor electrocardiographic abnormalities and their association with underlying cardiovascular disease and risk factors in Hispanics/Latinos (from the Hispanic Community Health Study/Study of Latinos). Am. J. Cardiol. 112, 1667–1675 (2013).
Acknowledgements
We would like to thank Mashhad University of Medical Sciences for supporting this research.
Funding
The collecting of clinical data was financially supported by Mashhad University of Medical Sciences.
Author information
Authors and Affiliations
Contributions
All authors have read and approved the manuscript. Study concept and design: TS and SSS; data collection: JA, MN, AI, ME; Analysis and interpretation of data: RA and HE; Drafting of the manuscript: TS, SMAD, YG; Critical revision of the manuscript for important intellectual content: GF, MG, SSS, and MM.
Corresponding authors
Ethics declarations
Competing interests
The authors declare no competing interests.
Additional information
Publisher's note
Springer Nature remains neutral with regard to jurisdictional claims in published maps and institutional affiliations.
Rights and permissions
Open Access This article is licensed under a Creative Commons Attribution 4.0 International License, which permits use, sharing, adaptation, distribution and reproduction in any medium or format, as long as you give appropriate credit to the original author(s) and the source, provide a link to the Creative Commons licence, and indicate if changes were made. The images or other third party material in this article are included in the article's Creative Commons licence, unless indicated otherwise in a credit line to the material. If material is not included in the article's Creative Commons licence and your intended use is not permitted by statutory regulation or exceeds the permitted use, you will need to obtain permission directly from the copyright holder. To view a copy of this licence, visit http://creativecommons.org/licenses/by/4.0/.
About this article

Cite this article
Sahranavard, T., Alimi, R., Arabkhazaei, J. et al. Association of major and minor ECG abnormalities with traditional cardiovascular risk factors in the general population: a large scale study. Sci Rep 14, 11289 (2024). https://doi.org/10.1038/s41598-024-62142-8
Received:
Accepted:
Published:
DOI: https://doi.org/10.1038/s41598-024-62142-8
Comments
By submitting a comment you agree to abide by our Terms and Community Guidelines. If you find something abusive or that does not comply with our terms or guidelines please flag it as inappropriate.
